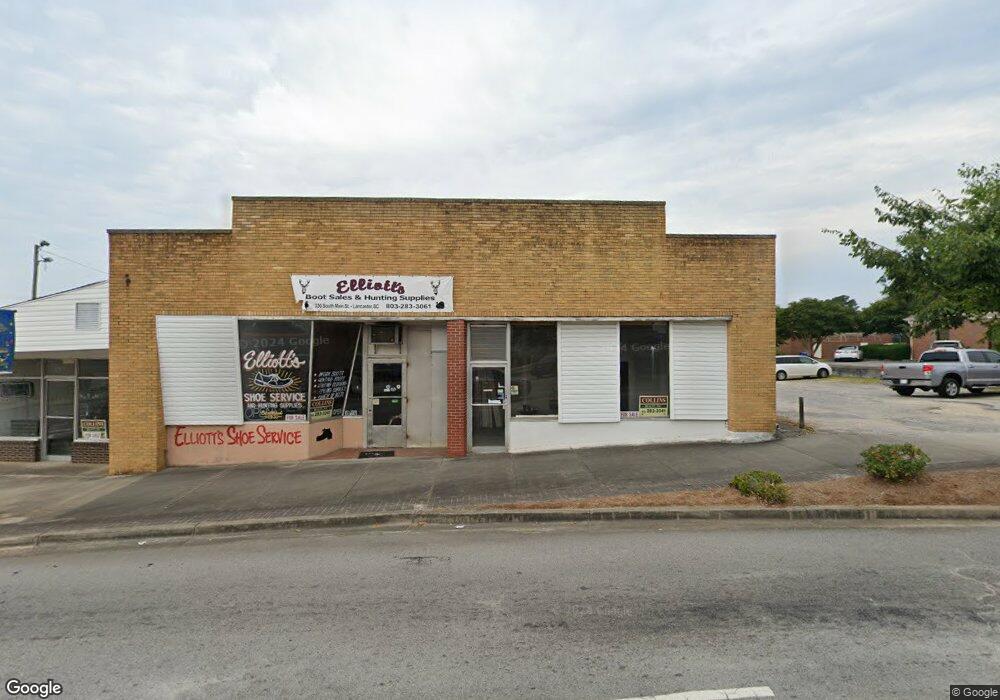
330 S Main St Lancaster, SC 29720
Estimated Value: $124,549
Studio
--
Bath
9,100
Sq Ft
$14/Sq Ft
Est. Value
About This Home
This home is located at 330 S Main St, Lancaster, SC 29720 and is currently priced at $124,549, approximately $13 per square foot. 330 S Main St is a home located in Lancaster County with nearby schools including Brooklyn Springs Elementary School, Buford Middle School, and Lancaster High School.
Ownership History
Date
Name
Owned For
Owner Type
Purchase Details
Closed on
Nov 10, 2025
Sold by
Lee Williams and Williams Elizabeth E
Bought by
Sharma Group Llc
Current Estimated Value
Home Financials for this Owner
Home Financials are based on the most recent Mortgage that was taken out on this home.
Original Mortgage
$171,214
Outstanding Balance
$161,406
Interest Rate
6.34%
Mortgage Type
New Conventional
Purchase Details
Closed on
Apr 9, 2002
Sold by
Coulson Coy F
Bought by
Williams Evy Lee and Williams Elizabeth E
Create a Home Valuation Report for This Property
The Home Valuation Report is an in-depth analysis detailing your home's value as well as a comparison with similar homes in the area
Home Values in the Area
Average Home Value in this Area
Purchase History
| Date | Buyer | Sale Price | Title Company |
|---|---|---|---|
| Sharma Group Llc | $175,000 | None Listed On Document | |
| Williams Evy Lee | $35,000 | -- |
Source: Public Records
Mortgage History
| Date | Status | Borrower | Loan Amount |
|---|---|---|---|
| Open | Sharma Group Llc | $171,214 |
Source: Public Records
Tax History
| Year | Tax Paid | Tax Assessment Tax Assessment Total Assessment is a certain percentage of the fair market value that is determined by local assessors to be the total taxable value of land and additions on the property. | Land | Improvement |
|---|---|---|---|---|
| 2025 | $1,636 | $4,300 | $1,034 | $3,266 |
| 2024 | $1,636 | $3,739 | $1,040 | $2,699 |
| 2023 | $1,667 | $3,739 | $1,040 | $2,699 |
| 2022 | $1,670 | $3,739 | $1,040 | $2,699 |
| 2021 | $1,648 | $3,739 | $1,040 | $2,699 |
| 2020 | $1,418 | $3,252 | $1,110 | $2,142 |
| 2019 | $1,661 | $3,252 | $1,110 | $2,142 |
| 2018 | $1,058 | $3,252 | $1,110 | $2,142 |
| 2017 | $1,329 | $0 | $0 | $0 |
| 2016 | $1,336 | $0 | $0 | $0 |
| 2015 | $1,263 | $0 | $0 | $0 |
| 2014 | $1,263 | $0 | $0 | $0 |
| 2013 | $1,263 | $0 | $0 | $0 |
Source: Public Records
Map
Nearby Homes
Your Personal Tour Guide
Ask me questions while you tour the home.