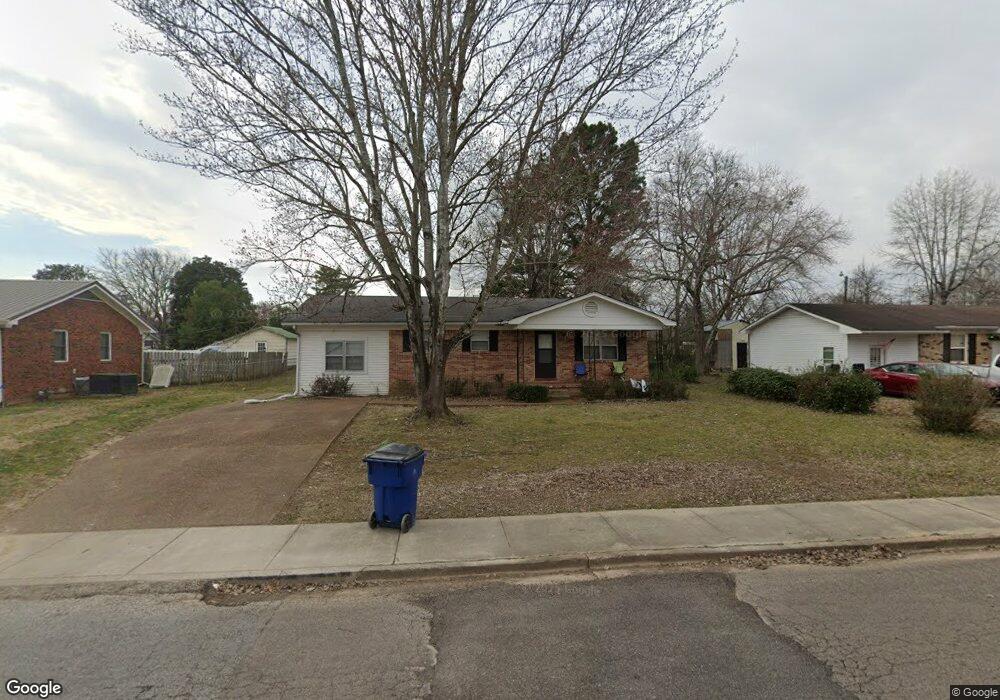
330 Walnut St Savannah, TN 38372
Estimated Value: $134,813 - $146,000
--
Bed
1
Bath
1,323
Sq Ft
$105/Sq Ft
Est. Value
About This Home
This home is located at 330 Walnut St, Savannah, TN 38372 and is currently estimated at $139,453, approximately $105 per square foot. 330 Walnut St is a home located in Hardin County with nearby schools including Hardin County High School and Hardin County Christian School.
Ownership History
Date
Name
Owned For
Owner Type
Purchase Details
Closed on
Nov 4, 2005
Sold by
Love Tommy
Bought by
Lillard Neal
Current Estimated Value
Home Financials for this Owner
Home Financials are based on the most recent Mortgage that was taken out on this home.
Original Mortgage
$50,880
Outstanding Balance
$29,931
Interest Rate
7.27%
Estimated Equity
$109,522
Purchase Details
Closed on
Dec 27, 1996
Sold by
Kelly Veverly
Bought by
Love Tommy
Purchase Details
Closed on
Aug 30, 1995
Sold by
United States Of America
Bought by
Kelly Veverly
Purchase Details
Closed on
Mar 3, 1995
Bought by
King Mark
Purchase Details
Closed on
Oct 15, 1993
Bought by
United States Of America % Farmers Home
Purchase Details
Closed on
May 25, 1989
Bought by
Garrard Robert W
Purchase Details
Closed on
Feb 1, 1988
Bought by
Allen James and Allen Pamela
Purchase Details
Closed on
Nov 16, 1987
Bought by
U S Of A
Purchase Details
Closed on
Jul 7, 1986
Bought by
Seat Sheila D
Create a Home Valuation Report for This Property
The Home Valuation Report is an in-depth analysis detailing your home's value as well as a comparison with similar homes in the area
Home Values in the Area
Average Home Value in this Area
Purchase History
| Date | Buyer | Sale Price | Title Company |
|---|---|---|---|
| Lillard Neal | $63,600 | -- | |
| Love Tommy | $35,000 | -- | |
| Kelly Veverly | $38,000 | -- | |
| King Mark | $35,000 | -- | |
| United States Of America % Farmers Home | -- | -- | |
| Garrard Robert W | -- | -- | |
| Allen James | -- | -- | |
| U S Of A | -- | -- | |
| Seat Sheila D | -- | -- |
Source: Public Records
Mortgage History
| Date | Status | Borrower | Loan Amount |
|---|---|---|---|
| Open | Seat Sheila D | $50,880 |
Source: Public Records
Tax History Compared to Growth
Tax History
| Year | Tax Paid | Tax Assessment Tax Assessment Total Assessment is a certain percentage of the fair market value that is determined by local assessors to be the total taxable value of land and additions on the property. | Land | Improvement |
|---|---|---|---|---|
| 2024 | $508 | $20,725 | $2,250 | $18,475 |
| 2023 | $508 | $20,725 | $2,250 | $18,475 |
| 2022 | $418 | $15,150 | $1,875 | $13,275 |
| 2021 | $418 | $15,150 | $1,875 | $13,275 |
| 2020 | $418 | $15,150 | $1,875 | $13,275 |
| 2019 | $418 | $15,150 | $1,875 | $13,275 |
| 2018 | $408 | $15,150 | $1,875 | $13,275 |
| 2017 | $368 | $13,225 | $1,500 | $11,725 |
| 2016 | $368 | $13,225 | $1,500 | $11,725 |
| 2015 | $333 | $13,225 | $1,500 | $11,725 |
| 2014 | $333 | $13,225 | $1,500 | $11,725 |
Source: Public Records
Map
Nearby Homes
- 00 Squaw St
- 134 Horse Creek Rd
- 65 Walnut St
- 635 Harbert Dr
- 115 Rb Dr
- 700 Harbert Dr
- 70 Red Fern Cove
- 870 Main St E
- 280 Meadowlane Dr
- 160 Harbert Dr
- 295 Claybrook Dr
- 250 Parkview Dr
- 1820 Pinhook Rd
- 165 Foursquare St
- 710 Main St E
- 80 Northcutt St
- 80 Quartet Cir
- 25 Northcutt St
- 190 Turner Kyle Dr
- 200 Hardin Rd