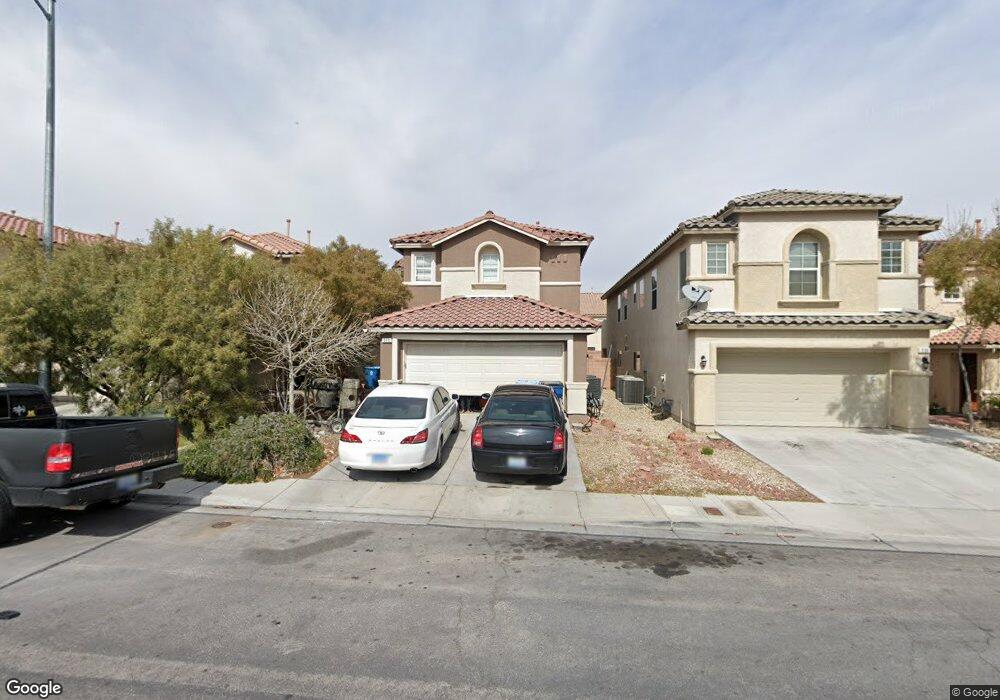
330 Windsor Ridge Ave Las Vegas, NV 89183
Silverado Ranch NeighborhoodEstimated Value: $430,874 - $486,000
4
Beds
3
Baths
2,282
Sq Ft
$204/Sq Ft
Est. Value
About This Home
This home is located at 330 Windsor Ridge Ave, Las Vegas, NV 89183 and is currently estimated at $465,219, approximately $203 per square foot. 330 Windsor Ridge Ave is a home located in Clark County with nearby schools including Steve Schorr Elementary School, Del E. Webb Middle School, and Liberty High School.
Ownership History
Date
Name
Owned For
Owner Type
Purchase Details
Closed on
Mar 1, 2012
Sold by
The Bank Of New York Mellon
Bought by
Bean Jodie M
Current Estimated Value
Home Financials for this Owner
Home Financials are based on the most recent Mortgage that was taken out on this home.
Original Mortgage
$131,577
Outstanding Balance
$92,636
Interest Rate
4.4%
Mortgage Type
FHA
Estimated Equity
$372,583
Purchase Details
Closed on
May 2, 2011
Sold by
Dimayuga Heraclio D and Talactac Leihson
Bought by
The Bank Of New York Mellon and The Bank Of New York
Purchase Details
Closed on
Nov 29, 2008
Sold by
Dimayuga Heraclio D and Talatac Leihson
Bought by
Dimayuga Heraclio D
Purchase Details
Closed on
May 8, 2006
Sold by
Shepherd Elizabeth S
Bought by
Talactac Leihson
Home Financials for this Owner
Home Financials are based on the most recent Mortgage that was taken out on this home.
Original Mortgage
$263,375
Interest Rate
9.25%
Purchase Details
Closed on
May 3, 2006
Sold by
Kb Home Nevada Inc
Bought by
Dimayuga Heraclio D and Talatac Leihson
Home Financials for this Owner
Home Financials are based on the most recent Mortgage that was taken out on this home.
Original Mortgage
$263,375
Interest Rate
9.25%
Create a Home Valuation Report for This Property
The Home Valuation Report is an in-depth analysis detailing your home's value as well as a comparison with similar homes in the area
Home Values in the Area
Average Home Value in this Area
Purchase History
| Date | Buyer | Sale Price | Title Company |
|---|---|---|---|
| Bean Jodie M | $135,000 | Fidelity Rainbow | |
| The Bank Of New York Mellon | $126,000 | Lsi Title Agency Inc | |
| Dimayuga Heraclio D | -- | None Available | |
| Talactac Leihson | -- | First Amer Title Co Of Nv | |
| Dimayuga Heraclio D | $329,219 | First Amer Title Co Of Nv |
Source: Public Records
Mortgage History
| Date | Status | Borrower | Loan Amount |
|---|---|---|---|
| Open | Bean Jodie M | $131,577 | |
| Previous Owner | Dimayuga Heraclio D | $263,375 |
Source: Public Records
Tax History Compared to Growth
Tax History
| Year | Tax Paid | Tax Assessment Tax Assessment Total Assessment is a certain percentage of the fair market value that is determined by local assessors to be the total taxable value of land and additions on the property. | Land | Improvement |
|---|---|---|---|---|
| 2025 | $1,866 | $127,060 | $39,200 | $87,860 |
| 2024 | $1,812 | $127,060 | $39,200 | $87,860 |
| 2023 | $1,812 | $116,613 | $33,950 | $82,663 |
| 2022 | $1,768 | $103,041 | $27,650 | $75,391 |
| 2021 | $1,709 | $96,757 | $25,200 | $71,557 |
| 2020 | $1,656 | $96,062 | $25,200 | $70,862 |
| 2019 | $1,636 | $91,661 | $22,050 | $69,611 |
| 2018 | $1,561 | $83,801 | $17,500 | $66,301 |
| 2017 | $2,438 | $83,118 | $16,100 | $67,018 |
| 2016 | $1,462 | $69,936 | $12,950 | $56,986 |
| 2015 | $1,458 | $52,329 | $9,450 | $42,879 |
| 2014 | $1,416 | $46,830 | $5,250 | $41,580 |
Source: Public Records
Map
Nearby Homes
- 11668 Tierney Creek Dr
- 11609 Andorra St
- 326 E Neal Ave
- 218 Lantana Breeze Dr
- 3758 Bright Aquarius Ln
- 3724 Canis Minor Ln Unit 21101
- 1271 Dorado Sea Ct
- 1267 Dorado Sea Ct
- 3717 Canis Minor Ln Unit 11101
- 11819 Bella Luna St
- 11771 Bergamo Ct
- 178 Elexese Ct
- 144 Bella Milano Ave
- 11769 Elianto St
- 11560 S Stivali St
- The Jefferson Plan at Liberty - Series 1
- The Hamilton Plan at Liberty - Series 1
- The Fraklin Plan at Liberty - Series 1
- Cesena Plan at Liberty - Series 3
- Layton Plan at Liberty - Series 2
- 328 Windsor Ridge Ave
- 334 Windsor Ridge Ave
- 338 Windsor Ridge Ave
- 326 Windsor Ridge Ave
- 324 Windsor Ridge Ave
- 340 Windsor Ridge Ave
- 340 Windsor Ridge Ave
- 340 Windsor Ridge Ave
- 327 Bianco Ridge Ave
- 331 Bianco Ridge Ave
- 323 Bianco Ridge Ave
- 335 Bianco Ridge Ave
- 342 Windsor Ridge Ave
- 11670 Splendor View Dr
- 322 Windsor Ridge Ave
- 11669 Splendor View Dr
- 319 Bianco Ridge Ave
- 339 Bianco Ridge Ave
- 11673 Splendor View Dr Unit 2
- 318 Windsor Ridge Ave