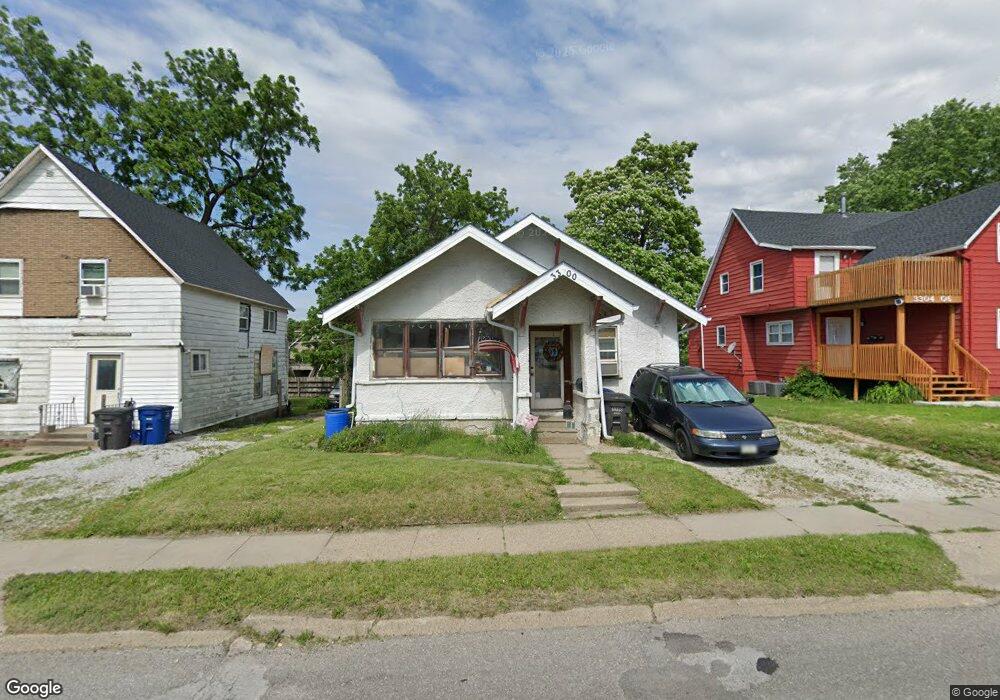
3300 2nd Ave Des Moines, IA 50313
Highland Park NeighborhoodEstimated Value: $152,981 - $169,000
3
Beds
1
Bath
1,260
Sq Ft
$127/Sq Ft
Est. Value
About This Home
This home is located at 3300 2nd Ave, Des Moines, IA 50313 and is currently estimated at $160,495, approximately $127 per square foot. 3300 2nd Ave is a home located in Polk County with nearby schools including Oak Park Elementary School, Harding Middle School, and North High School.
Ownership History
Date
Name
Owned For
Owner Type
Purchase Details
Closed on
Aug 31, 2006
Sold by
Rose Land & Finance Corp
Bought by
Reyes Alexander M
Current Estimated Value
Home Financials for this Owner
Home Financials are based on the most recent Mortgage that was taken out on this home.
Original Mortgage
$66,696
Outstanding Balance
$40,304
Interest Rate
6.88%
Mortgage Type
FHA
Estimated Equity
$120,191
Purchase Details
Closed on
Aug 1, 2006
Sold by
First National Acceptance Co
Bought by
Rose Land & Finance Corp
Home Financials for this Owner
Home Financials are based on the most recent Mortgage that was taken out on this home.
Original Mortgage
$66,696
Outstanding Balance
$40,304
Interest Rate
6.88%
Mortgage Type
FHA
Estimated Equity
$120,191
Purchase Details
Closed on
Feb 5, 2001
Sold by
West Franklin D and West Sandra L
Bought by
First National Acceptance Company
Purchase Details
Closed on
Mar 29, 1999
Sold by
West Franklin D and West Sandra L
Bought by
Madison Barbara
Home Financials for this Owner
Home Financials are based on the most recent Mortgage that was taken out on this home.
Original Mortgage
$69,300
Interest Rate
7.77%
Mortgage Type
Seller Take Back
Create a Home Valuation Report for This Property
The Home Valuation Report is an in-depth analysis detailing your home's value as well as a comparison with similar homes in the area
Home Values in the Area
Average Home Value in this Area
Purchase History
| Date | Buyer | Sale Price | Title Company |
|---|---|---|---|
| Reyes Alexander M | $33,800 | None Available | |
| Rose Land & Finance Corp | -- | None Available | |
| First National Acceptance Company | -- | -- | |
| Madison Barbara | $70,000 | -- |
Source: Public Records
Mortgage History
| Date | Status | Borrower | Loan Amount |
|---|---|---|---|
| Open | Reyes Alexander M | $66,696 | |
| Previous Owner | Madison Barbara | $69,300 |
Source: Public Records
Tax History
| Year | Tax Paid | Tax Assessment Tax Assessment Total Assessment is a certain percentage of the fair market value that is determined by local assessors to be the total taxable value of land and additions on the property. | Land | Improvement |
|---|---|---|---|---|
| 2025 | $1,710 | $122,100 | $26,200 | $95,900 |
| 2024 | $1,710 | $106,000 | $22,700 | $83,300 |
| 2023 | $1,756 | $106,000 | $22,700 | $83,300 |
| 2022 | $1,740 | $86,800 | $19,200 | $67,600 |
| 2021 | $1,622 | $86,800 | $19,200 | $67,600 |
| 2020 | $1,678 | $76,900 | $17,200 | $59,700 |
| 2019 | $1,580 | $76,900 | $17,200 | $59,700 |
| 2018 | $1,558 | $70,600 | $15,600 | $55,000 |
| 2017 | $1,404 | $70,600 | $15,600 | $55,000 |
| 2016 | $1,362 | $63,700 | $14,000 | $49,700 |
| 2015 | $1,362 | $63,700 | $14,000 | $49,700 |
| 2014 | $1,206 | $59,400 | $13,000 | $46,400 |
Source: Public Records
Map
Nearby Homes
Your Personal Tour Guide
Ask me questions while you tour the home.