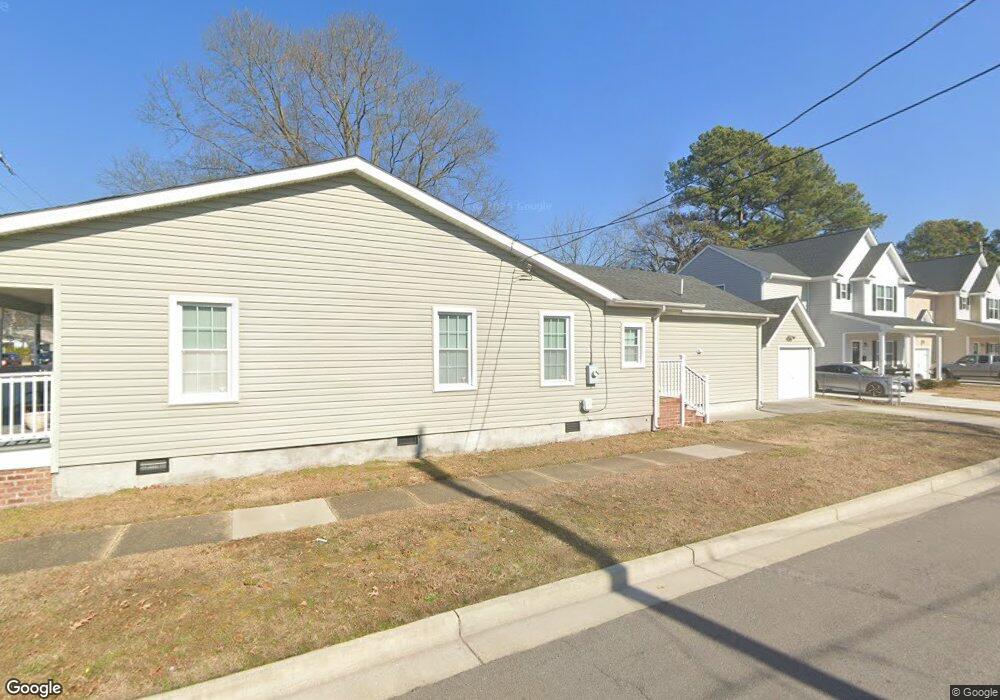
3300 Argonne Ave Norfolk, VA 23509
Fairmount Park NeighborhoodEstimated Value: $249,000 - $310,000
3
Beds
2
Baths
1,380
Sq Ft
$205/Sq Ft
Est. Value
About This Home
This home is located at 3300 Argonne Ave, Norfolk, VA 23509 and is currently estimated at $282,295, approximately $204 per square foot. 3300 Argonne Ave is a home located in Norfolk City with nearby schools including Frances E. Willard Model Elementary School, Norview Middle School, and Maury High School.
Ownership History
Date
Name
Owned For
Owner Type
Purchase Details
Closed on
Jun 19, 2019
Sold by
Harrell Maggie G and Harrell Moran M
Bought by
Harrell Maggie G
Current Estimated Value
Purchase Details
Closed on
Sep 18, 2015
Sold by
3300 Argonne Llc A Virginia Limited Liab
Bought by
Turner Maggie G and Harrell Moran M
Home Financials for this Owner
Home Financials are based on the most recent Mortgage that was taken out on this home.
Original Mortgage
$166,920
Outstanding Balance
$131,373
Interest Rate
3.97%
Mortgage Type
FHA
Estimated Equity
$150,922
Purchase Details
Closed on
Mar 13, 2013
Sold by
Gata Ray D
Bought by
Federal National Mortgage Association
Purchase Details
Closed on
Mar 2, 2007
Sold by
Mitchell Randolph and Mitchell Angela S
Bought by
Gata Ray D
Home Financials for this Owner
Home Financials are based on the most recent Mortgage that was taken out on this home.
Original Mortgage
$100,700
Interest Rate
8.12%
Mortgage Type
Adjustable Rate Mortgage/ARM
Create a Home Valuation Report for This Property
The Home Valuation Report is an in-depth analysis detailing your home's value as well as a comparison with similar homes in the area
Home Values in the Area
Average Home Value in this Area
Purchase History
| Date | Buyer | Sale Price | Title Company |
|---|---|---|---|
| Harrell Maggie G | -- | None Available | |
| Turner Maggie G | $170,000 | Virginia Home Title & Stlmnt | |
| Federal National Mortgage Association | $107,602 | None Available | |
| Gata Ray D | $106,000 | -- |
Source: Public Records
Mortgage History
| Date | Status | Borrower | Loan Amount |
|---|---|---|---|
| Open | Turner Maggie G | $166,920 | |
| Previous Owner | Gata Ray D | $100,700 |
Source: Public Records
Tax History Compared to Growth
Tax History
| Year | Tax Paid | Tax Assessment Tax Assessment Total Assessment is a certain percentage of the fair market value that is determined by local assessors to be the total taxable value of land and additions on the property. | Land | Improvement |
|---|---|---|---|---|
| 2025 | $3,105 | $248,400 | $40,000 | $208,400 |
| 2024 | $3,000 | $243,900 | $40,000 | $203,900 |
| 2023 | $2,876 | $230,100 | $38,000 | $192,100 |
| 2022 | $2,714 | $217,100 | $31,500 | $185,600 |
| 2021 | $2,399 | $191,900 | $24,000 | $167,900 |
| 2020 | $2,305 | $184,400 | $19,500 | $164,900 |
| 2019 | $2,280 | $182,400 | $17,500 | $164,900 |
| 2018 | $2,088 | $167,000 | $17,500 | $149,500 |
| 2017 | $1,908 | $165,900 | $17,500 | $148,400 |
| 2016 | $1,908 | $92,800 | $17,400 | $75,400 |
| 2015 | $1,063 | $92,800 | $17,400 | $75,400 |
| 2014 | $1,063 | $92,800 | $17,400 | $75,400 |
Source: Public Records
Map
Nearby Homes
- 3230 Argonne Ave
- 3227 Marne Ave
- 2403 Lafayette Blvd
- 2315 Lafayette Blvd
- 3127 Peronne Ave
- 3302 Marne Ave
- 3109 Saint Mihiel Ave
- 3233 Dunkirk Ave
- 3126 Marne Ave
- 3312 Vimy Ridge Ave
- 3316 Vimy Ridge Ave
- 3117 Lyons Ave
- 2504 Cromwell Dr
- 2949 Verdun Ave
- 2941 Marne Ave
- 3126 Tidewater Dr
- 2110 Saint Denis Ave
- 3006 Ballentine Blvd
- 3033 Somme Ave
- 3006 Grandy Ave
- 3302 Argonne Ave
- 3306 Argonne Ave
- 3240 Argonne Ave
- 3303 Lens Ave
- 3308 Argonne Ave
- 2605 Pershing Ave
- 3238 Argonne Ave
- 3310 Argonne Ave
- 3301 Argonne Ave
- 3303 Argonne Ave
- 3309 Lens Ave
- 3305 Argonne Ave
- 2609 Pershing Ave
- 3236 Argonne Ave
- 3312 Argonne Ave
- 3311 Argonne Ave
- 3241 Argonne Ave
- 3237 Lens Ave
- 3315 Lens Ave
- 2610 Pershing Ave