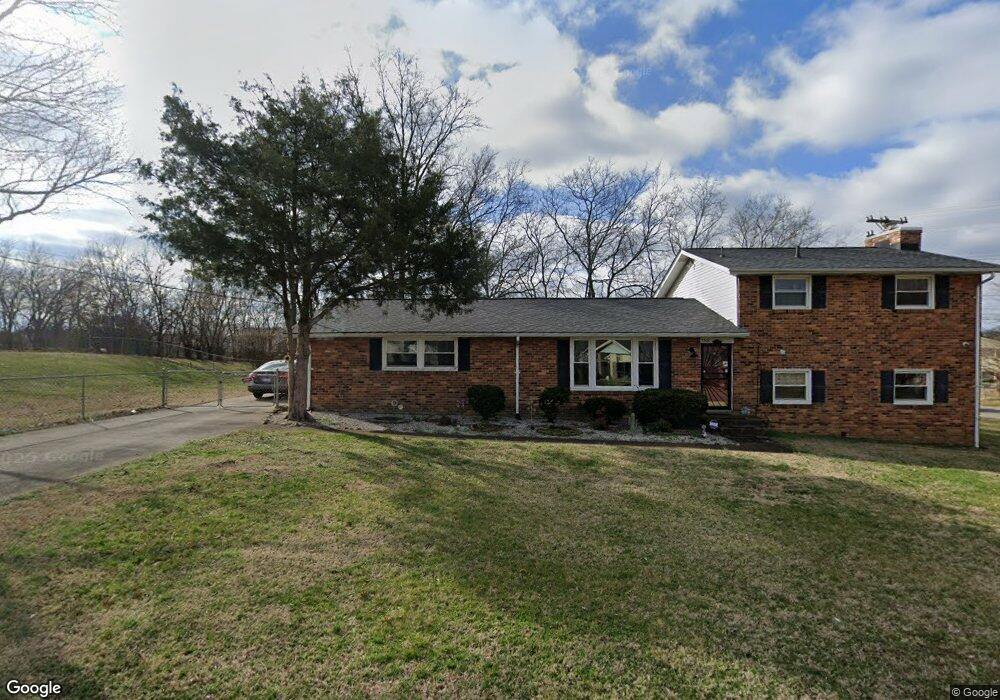
3300 Leondale Terrace Nashville, TN 37207
Parkwood Estates NeighborhoodEstimated Value: $298,000 - $375,000
3
Beds
2
Baths
1,794
Sq Ft
$189/Sq Ft
Est. Value
About This Home
This home is located at 3300 Leondale Terrace, Nashville, TN 37207 and is currently estimated at $338,350, approximately $188 per square foot. 3300 Leondale Terrace is a home located in Davidson County with nearby schools including Bellshire Elementary Design Center, Madison Middle Prep, and Hunters Lane Comprehensive High School.
Ownership History
Date
Name
Owned For
Owner Type
Purchase Details
Closed on
Nov 19, 2020
Sold by
Lealand Devleopment Llc
Bought by
Perkins Brian and Perkins Laurey
Current Estimated Value
Home Financials for this Owner
Home Financials are based on the most recent Mortgage that was taken out on this home.
Original Mortgage
$907,000
Outstanding Balance
$807,101
Interest Rate
2.8%
Mortgage Type
New Conventional
Estimated Equity
-$468,751
Purchase Details
Closed on
Oct 14, 2014
Sold by
Harris Rudolph R and Harris Ida J
Bought by
Page Kevin and Page Valerie A
Home Financials for this Owner
Home Financials are based on the most recent Mortgage that was taken out on this home.
Original Mortgage
$103,095
Interest Rate
4.17%
Mortgage Type
FHA
Purchase Details
Closed on
Sep 30, 1994
Sold by
Furman Frederic G
Bought by
Harris Rudolph R
Create a Home Valuation Report for This Property
The Home Valuation Report is an in-depth analysis detailing your home's value as well as a comparison with similar homes in the area
Home Values in the Area
Average Home Value in this Area
Purchase History
| Date | Buyer | Sale Price | Title Company |
|---|---|---|---|
| Perkins Brian | -- | Pillar Title & Escrow Llc | |
| Page Kevin | $105,000 | Stewart Title Company | |
| Harris Rudolph R | $80,000 | -- |
Source: Public Records
Mortgage History
| Date | Status | Borrower | Loan Amount |
|---|---|---|---|
| Open | Perkins Brian | $907,000 | |
| Previous Owner | Page Kevin | $103,095 |
Source: Public Records
Tax History Compared to Growth
Tax History
| Year | Tax Paid | Tax Assessment Tax Assessment Total Assessment is a certain percentage of the fair market value that is determined by local assessors to be the total taxable value of land and additions on the property. | Land | Improvement |
|---|---|---|---|---|
| 2024 | $1,776 | $54,575 | $10,125 | $44,450 |
| 2023 | $1,776 | $54,575 | $10,125 | $44,450 |
| 2022 | $1,776 | $54,575 | $10,125 | $44,450 |
| 2021 | $1,794 | $54,575 | $10,125 | $44,450 |
| 2020 | $1,598 | $37,850 | $8,250 | $29,600 |
| 2019 | $1,194 | $37,850 | $8,250 | $29,600 |
| 2018 | $1,194 | $37,850 | $8,250 | $29,600 |
| 2017 | $1,194 | $37,850 | $8,250 | $29,600 |
| 2016 | $1,207 | $26,725 | $5,000 | $21,725 |
| 2015 | $1,207 | $26,725 | $5,000 | $21,725 |
| 2014 | $1,207 | $26,725 | $5,000 | $21,725 |
Source: Public Records
Map
Nearby Homes
- 3313 Leondale Terrace
- 3247 Masonwood Dr
- 3240 Doverside Dr
- 3253 Rainwood Dr
- 116 Tiger Cir
- 3225 Sennadale Ln
- 3229 Moorewood Dr
- 3172 Lauren Evelyn Way
- 3136 Lauren Evelyn Way
- 3214 Doverside Dr
- 3116 Lauren Evelyn Way
- 3205 Leswood Ln
- 3320 Chesapeake Cir
- 3070 Richmond Hill Dr
- 3107 Meadowside Ln
- 3061 Richmond Hill Dr
- 413 Vailview Dr
- 4348 Skyridge Dr
- 4325 Skyridge Dr
- 3103 Brick Church Pike
- 3306 Moorewood Dr
- 3301 Leondale Terrace
- 3304 Moorewood Dr
- 3303 Leondale Terrace
- 3307 Moorewood Dr
- 3303 Doverside Dr
- 3309 Moorewood Dr
- 3305 Leondale Terrace
- 3251 Doverside Dr
- 3306 Leondale Terrace
- 3314 Moorewood Dr
- 3311 Moorewood Dr
- 3305 Doverside Dr
- 3307 Leondale Terrace
- 3304 Masonwood Dr
- 3313 Moorewood Dr
- 3302 Masonwood Dr
- 3308 Leondale Terrace
- 3307 Doverside Dr
- 3316 Moorewood Dr