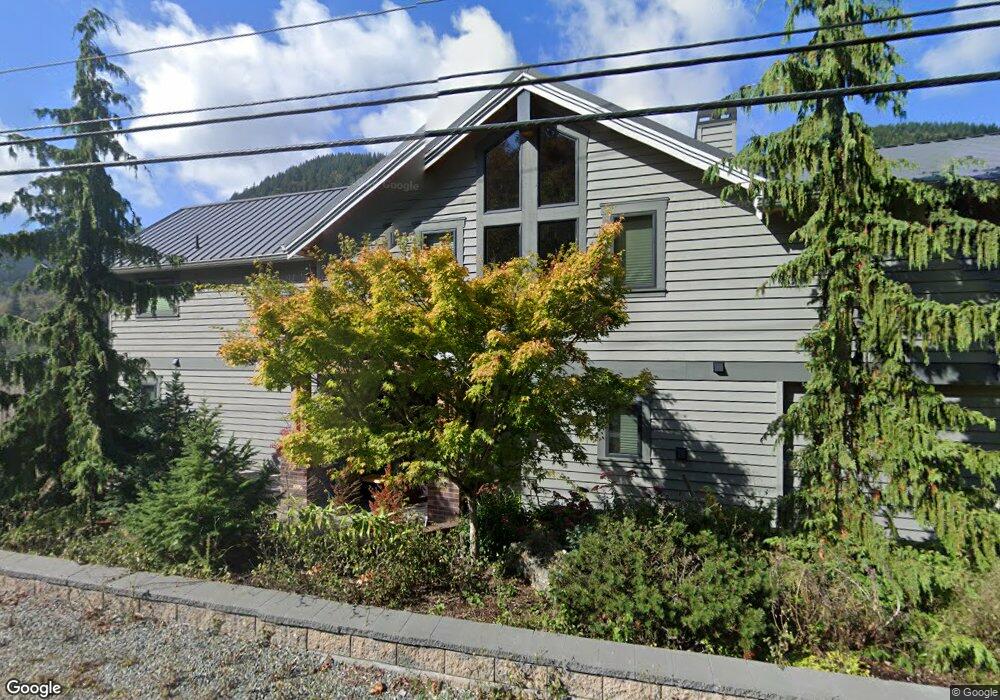
3300 S Bay Dr Sedro Woolley, WA 98284
Estimated Value: $1,429,000 - $2,714,000
3
Beds
3
Baths
3,547
Sq Ft
$588/Sq Ft
Est. Value
About This Home
This home is located at 3300 S Bay Dr, Sedro Woolley, WA 98284 and is currently estimated at $2,086,372, approximately $588 per square foot. 3300 S Bay Dr is a home located in Whatcom County with nearby schools including Mount Baker Senior High School.
Ownership History
Date
Name
Owned For
Owner Type
Purchase Details
Closed on
Apr 19, 2007
Sold by
Buggia Thomas W and Buggia Sheila Archangeli
Bought by
Bargreen John and Bargreen Teresa
Current Estimated Value
Home Financials for this Owner
Home Financials are based on the most recent Mortgage that was taken out on this home.
Original Mortgage
$362,000
Interest Rate
6.1%
Mortgage Type
Seller Take Back
Purchase Details
Closed on
May 24, 2005
Sold by
Alexander Gini K
Bought by
Buggia Thomas W and Archangeli Buggia Sheila
Home Financials for this Owner
Home Financials are based on the most recent Mortgage that was taken out on this home.
Original Mortgage
$447,200
Interest Rate
5.84%
Mortgage Type
Fannie Mae Freddie Mac
Purchase Details
Closed on
Jun 14, 1999
Sold by
Pettigrew John H
Bought by
Alexander Gini K
Create a Home Valuation Report for This Property
The Home Valuation Report is an in-depth analysis detailing your home's value as well as a comparison with similar homes in the area
Home Values in the Area
Average Home Value in this Area
Purchase History
| Date | Buyer | Sale Price | Title Company |
|---|---|---|---|
| Bargreen John | $762,780 | Stewart Title Company | |
| Buggia Thomas W | $559,000 | Stewart Title Company | |
| Alexander Gini K | -- | -- |
Source: Public Records
Mortgage History
| Date | Status | Borrower | Loan Amount |
|---|---|---|---|
| Closed | Bargreen John | $362,000 | |
| Previous Owner | Buggia Thomas W | $447,200 |
Source: Public Records
Tax History Compared to Growth
Tax History
| Year | Tax Paid | Tax Assessment Tax Assessment Total Assessment is a certain percentage of the fair market value that is determined by local assessors to be the total taxable value of land and additions on the property. | Land | Improvement |
|---|---|---|---|---|
| 2024 | $14,783 | $2,036,491 | $972,290 | $1,064,201 |
| 2023 | $14,783 | $2,189,779 | $1,045,475 | $1,144,304 |
| 2022 | $13,880 | $2,008,949 | $959,140 | $1,049,809 |
| 2021 | $12,623 | $1,545,345 | $737,800 | $807,545 |
| 2020 | $12,708 | $1,246,246 | $595,000 | $651,246 |
| 2019 | $12,084 | $1,246,246 | $595,000 | $651,246 |
| 2018 | $12,379 | $1,295,289 | $554,625 | $740,664 |
| 2017 | $8,598 | $1,028,261 | $535,925 | $492,336 |
| 2016 | $7,837 | $762,025 | $480,675 | $281,350 |
| 2015 | $8,118 | $687,911 | $433,925 | $253,986 |
| 2014 | -- | $687,911 | $433,925 | $253,986 |
| 2013 | -- | $673,762 | $425,000 | $248,762 |
Source: Public Records
Map
Nearby Homes
- 990 Lake Whatcom Blvd Unit 11
- 990 S Lake Whatcom Blvd Unit S
- 990 S Lake Whatcom Blvd Unit 9
- 990 S Lake Whatcom Blvd Unit 67
- 990 S Lake Whatcom Blvd Unit 48
- 990 S Lake Whatcom Blvd Unit 36
- 3130 S Bay Vista Dr
- 954 Kings View Ln
- 782 Summerset Way
- 750 West Rd
- 659 Cain Lake Rd
- 2972 Brook Ln
- 3026 Beaver Place
- 2984 Beaver Place
- 2967 Cedar Ln
- 519 Cain Lake Rd
- 561 Rainbow Dr
- 534 Hilltop Dr
- 530 Rainbow Dr
- 478 Fir Ln
- 33 S Bay Dr
- 968 Iowa Heights Rd
- 962 Iowa Heights Rd
- 1001 Iowa Heights Rd
- 931 Iowa Heights Rd
- 956 Iowa Heights Rd
- 1003 Iowa Heights Rd
- 955 Iowa Heights Rd
- 889 Iowa Heights Rd
- 941 Iowa Heights Rd
- 990 Lake Whatcom Blvd Unit 25
- 990 Lake Whatcom Blvd Unit 8
- 990 Lake Whatcom Blvd Unit 61
- 990 Lake Whatcom Blvd Unit 40
- 990 Lake Whatcom Blvd Unit 64
- 990 Lake Whatcom Blvd Unit 41
- 990 Lake Whatcom Blvd Unit 2
- 990 Lake Whatcom Blvd Unit 1
- 990 Lake Whatcom Blvd Unit 29
- 990 Lake Whatcom Blvd Unit 4