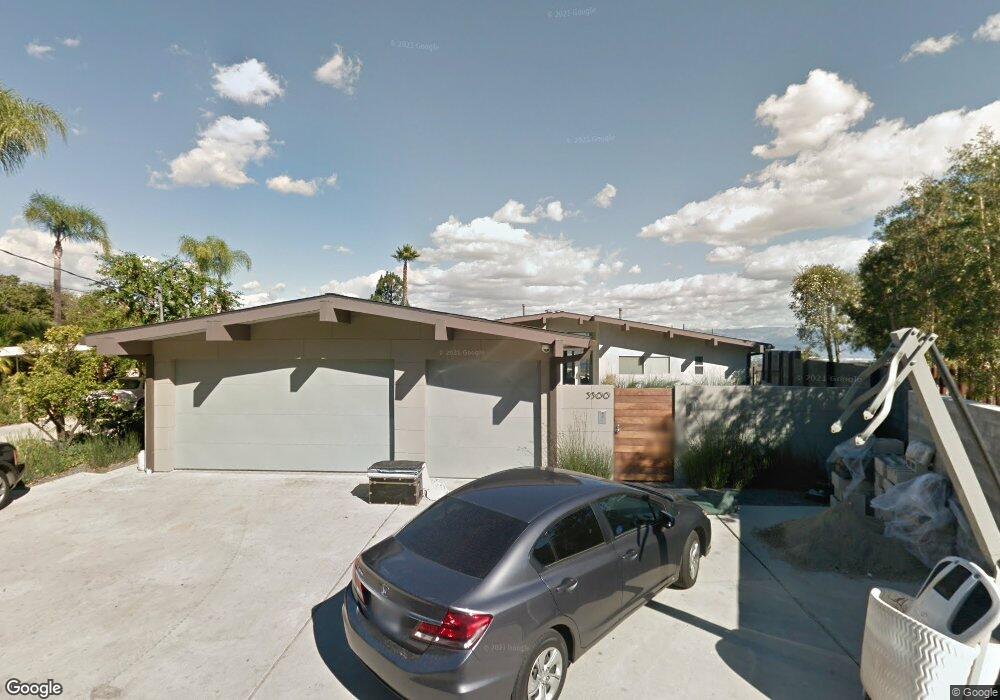
3300 Scadlock Ln Sherman Oaks, CA 91403
Estimated Value: $2,381,000 - $3,467,000
5
Beds
5
Baths
2,948
Sq Ft
$938/Sq Ft
Est. Value
About This Home
This home is located at 3300 Scadlock Ln, Sherman Oaks, CA 91403 and is currently estimated at $2,764,338, approximately $937 per square foot. 3300 Scadlock Ln is a home located in Los Angeles County with nearby schools including Roscomare Road Elementary, Van Nuys High School, and The Seed School of Los Angeles County.
Ownership History
Date
Name
Owned For
Owner Type
Purchase Details
Closed on
May 22, 2015
Sold by
Higinbotham Jeffrey and Yun Jasmine
Bought by
Higinbotham Yun 2015 Family Trust
Current Estimated Value
Purchase Details
Closed on
Dec 18, 2012
Sold by
Dobbins Shirley Kathleen and The 1988 Jean E Bowman Revocab
Bought by
Higinbotham Jeffrey and Yun Jasmine
Home Financials for this Owner
Home Financials are based on the most recent Mortgage that was taken out on this home.
Original Mortgage
$840,000
Outstanding Balance
$585,534
Interest Rate
3.5%
Mortgage Type
New Conventional
Estimated Equity
$2,178,804
Create a Home Valuation Report for This Property
The Home Valuation Report is an in-depth analysis detailing your home's value as well as a comparison with similar homes in the area
Home Values in the Area
Average Home Value in this Area
Purchase History
| Date | Buyer | Sale Price | Title Company |
|---|---|---|---|
| Higinbotham Yun 2015 Family Trust | -- | None Available | |
| Higinbotham Jeffrey | $1,050,000 | Equity Title Los Angeles |
Source: Public Records
Mortgage History
| Date | Status | Borrower | Loan Amount |
|---|---|---|---|
| Open | Higinbotham Jeffrey | $840,000 |
Source: Public Records
Tax History Compared to Growth
Tax History
| Year | Tax Paid | Tax Assessment Tax Assessment Total Assessment is a certain percentage of the fair market value that is determined by local assessors to be the total taxable value of land and additions on the property. | Land | Improvement |
|---|---|---|---|---|
| 2025 | $17,725 | $1,442,892 | $1,034,393 | $408,499 |
| 2024 | $17,725 | $1,414,601 | $1,014,111 | $400,490 |
| 2023 | $17,388 | $1,386,865 | $994,227 | $392,638 |
| 2022 | $16,618 | $1,359,673 | $974,733 | $384,940 |
| 2021 | $16,414 | $1,333,014 | $955,621 | $377,393 |
| 2019 | $15,865 | $1,293,478 | $927,278 | $366,200 |
| 2018 | $15,655 | $1,268,117 | $909,097 | $359,020 |
| 2016 | $14,932 | $1,218,877 | $873,797 | $345,080 |
| 2015 | $14,704 | $1,075,839 | $860,672 | $215,167 |
| 2014 | -- | $1,054,766 | $843,813 | $210,953 |
Source: Public Records
Map
Nearby Homes
- 3535 Vista Haven Rd
- 15216 Antelo Place
- 15210 Antelo Place
- 2911 Antelo View Dr
- 15415 Milldale Dr
- 3350 Stoneridge Ln
- 3530 Royal Woods Dr
- 3637 Loadstone Dr
- 15440 Hamner Dr
- 15508 Royal Ridge Rd
- 2557 Roscomare Rd
- 15656 Crownridge Place
- 3690 Crownridge Dr
- 3421 Castlewoods Place
- 2451 Nalin Dr
- 3847 Royal Woods Dr
- 0 Rayneta Dr
- 3873 Royal Woods Dr
- 14652 Deervale Place
- 2400 Nalin Dr
- 3302 Scadlock Ln
- 3304 Scadlock Ln
- 3301 Scadlock Ln
- 3303 Scadlock Ln
- 3400 Longbow Ct
- 3308 Scadlock Ln
- 15129 Mulholland Dr
- 15267 Mulholland Dr
- 3406 Longbow Ct
- 15269 Mulholland Dr
- 15249 Mulholland Dr
- 15263 Mulholland Dr
- 3307 Scadlock Ln
- 3359 Vista Haven Rd
- 15332 Longbow Dr
- 3314 Scadlock Ln
- 15322 Longbow Dr
- 15245 Mulholland Dr
- 3311 Scadlock Ln
- 3433 Shernoll Place