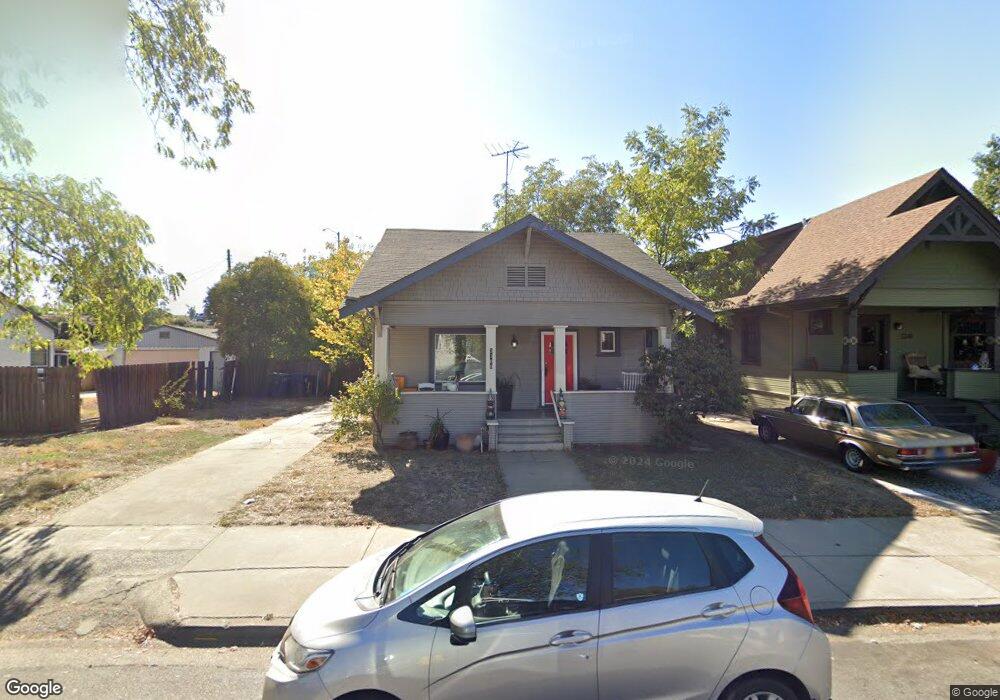
3300 T St Sacramento, CA 95816
East Sacramento NeighborhoodEstimated Value: $287,000 - $589,000
2
Beds
1
Bath
1,044
Sq Ft
$452/Sq Ft
Est. Value
About This Home
This home is located at 3300 T St, Sacramento, CA 95816 and is currently estimated at $471,909, approximately $452 per square foot. 3300 T St is a home located in Sacramento County with nearby schools including David Lubin Elementary, Miwok Middle School, and Hiram W. Johnson High School.
Ownership History
Date
Name
Owned For
Owner Type
Purchase Details
Closed on
Mar 12, 2010
Sold by
Navarrete Teresa
Bought by
Navarrete Jose and Navarrete Teresa
Current Estimated Value
Purchase Details
Closed on
Aug 26, 2004
Sold by
Navarrete Jose
Bought by
Navarrete Teresa
Home Financials for this Owner
Home Financials are based on the most recent Mortgage that was taken out on this home.
Original Mortgage
$176,000
Outstanding Balance
$83,507
Interest Rate
5.25%
Mortgage Type
New Conventional
Estimated Equity
$388,402
Create a Home Valuation Report for This Property
The Home Valuation Report is an in-depth analysis detailing your home's value as well as a comparison with similar homes in the area
Home Values in the Area
Average Home Value in this Area
Purchase History
| Date | Buyer | Sale Price | Title Company |
|---|---|---|---|
| Navarrete Jose | -- | None Available | |
| Navarrete Teresa | -- | Fidelity National Title Co | |
| Navarrete Teresa | $220,000 | Fidelity National Title Co |
Source: Public Records
Mortgage History
| Date | Status | Borrower | Loan Amount |
|---|---|---|---|
| Open | Navarrete Teresa | $176,000 | |
| Closed | Navarrete Teresa | $44,000 |
Source: Public Records
Tax History Compared to Growth
Tax History
| Year | Tax Paid | Tax Assessment Tax Assessment Total Assessment is a certain percentage of the fair market value that is determined by local assessors to be the total taxable value of land and additions on the property. | Land | Improvement |
|---|---|---|---|---|
| 2025 | $3,664 | $306,644 | $97,566 | $209,078 |
| 2024 | $3,664 | $300,632 | $95,653 | $204,979 |
| 2023 | $3,579 | $294,738 | $93,778 | $200,960 |
| 2022 | $3,519 | $288,960 | $91,940 | $197,020 |
| 2021 | $3,353 | $283,295 | $90,138 | $193,157 |
| 2020 | $3,381 | $280,391 | $89,214 | $191,177 |
| 2019 | $3,310 | $274,894 | $87,465 | $187,429 |
| 2018 | $3,224 | $269,504 | $85,750 | $183,754 |
| 2017 | $3,180 | $264,220 | $84,069 | $180,151 |
| 2016 | $3,106 | $259,040 | $82,421 | $176,619 |
| 2015 | $3,061 | $255,150 | $81,183 | $173,967 |
| 2014 | $2,471 | $205,202 | $65,291 | $139,911 |
Source: Public Records
Map
Nearby Homes