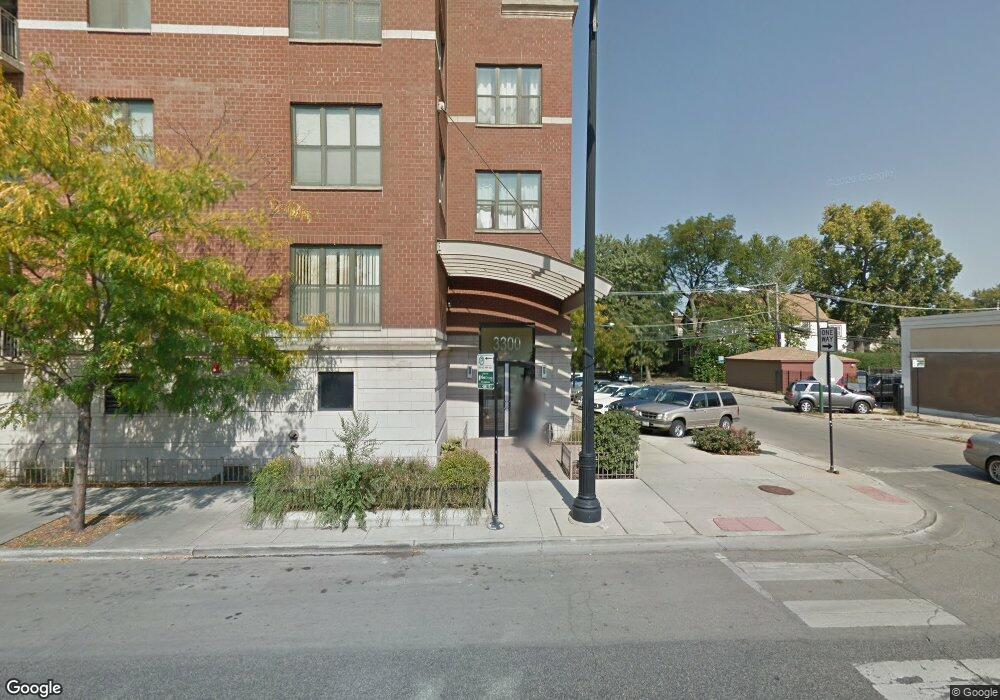
3300 W Irving Park Rd Unit E2 Chicago, IL 60618
Irving Park NeighborhoodEstimated Value: $348,000 - $383,000
2
Beds
2
Baths
1,350
Sq Ft
$266/Sq Ft
Est. Value
About This Home
This home is located at 3300 W Irving Park Rd Unit E2, Chicago, IL 60618 and is currently estimated at $359,593, approximately $266 per square foot. 3300 W Irving Park Rd Unit E2 is a home located in Cook County with nearby schools including Henry Elementary School, Roosevelt High School, and CICS Irving Park.
Ownership History
Date
Name
Owned For
Owner Type
Purchase Details
Closed on
Apr 19, 2012
Sold by
Vanderbilt Mortgage & Finance Inc
Bought by
Pittman Nicholas T
Current Estimated Value
Home Financials for this Owner
Home Financials are based on the most recent Mortgage that was taken out on this home.
Original Mortgage
$139,900
Outstanding Balance
$97,402
Interest Rate
4.08%
Mortgage Type
New Conventional
Estimated Equity
$262,191
Purchase Details
Closed on
Sep 29, 2011
Sold by
Ranalli Kevin J
Bought by
Vanderbilt Mortgage & Financial Inc
Purchase Details
Closed on
Jul 31, 2007
Sold by
Diversey Llc
Bought by
Ranalli Kevin J
Home Financials for this Owner
Home Financials are based on the most recent Mortgage that was taken out on this home.
Original Mortgage
$309,900
Interest Rate
14.85%
Mortgage Type
Balloon
Create a Home Valuation Report for This Property
The Home Valuation Report is an in-depth analysis detailing your home's value as well as a comparison with similar homes in the area
Home Values in the Area
Average Home Value in this Area
Purchase History
| Date | Buyer | Sale Price | Title Company |
|---|---|---|---|
| Pittman Nicholas T | $175,000 | None Available | |
| Vanderbilt Mortgage & Financial Inc | -- | None Available | |
| Ranalli Kevin J | $310,000 | Multiple |
Source: Public Records
Mortgage History
| Date | Status | Borrower | Loan Amount |
|---|---|---|---|
| Open | Pittman Nicholas T | $139,900 | |
| Previous Owner | Ranalli Kevin J | $309,900 |
Source: Public Records
Tax History Compared to Growth
Tax History
| Year | Tax Paid | Tax Assessment Tax Assessment Total Assessment is a certain percentage of the fair market value that is determined by local assessors to be the total taxable value of land and additions on the property. | Land | Improvement |
|---|---|---|---|---|
| 2024 | $5,031 | $28,135 | $2,701 | $25,434 |
| 2023 | $4,878 | $25,920 | $2,178 | $23,742 |
| 2022 | $4,878 | $25,920 | $2,178 | $23,742 |
| 2021 | $4,782 | $25,919 | $2,178 | $23,741 |
| 2020 | $3,400 | $18,314 | $958 | $17,356 |
| 2019 | $3,420 | $20,394 | $958 | $19,436 |
| 2018 | $3,361 | $20,394 | $958 | $19,436 |
| 2017 | $2,661 | $15,697 | $871 | $14,826 |
| 2016 | $2,653 | $15,697 | $871 | $14,826 |
| 2015 | $2,404 | $15,697 | $871 | $14,826 |
| 2014 | $2,356 | $15,219 | $784 | $14,435 |
| 2013 | $2,778 | $15,219 | $784 | $14,435 |
Source: Public Records
Map
Nearby Homes
- 4018 N Spaulding Ave Unit 2
- 3940 N Christiana Ave
- 4026 N Kimball Ave
- 3934 N Sawyer Ave
- 3223 W Belle Plaine Ave
- 3923 N Bernard St
- 3855 N Christiana Ave
- 3853 N Spaulding Ave
- 3908 N Bernard St
- 3925 N Saint Louis Ave
- 4116 N Kedzie Ave
- 3911 N Kedzie Ave
- 3911 N Saint Louis Ave
- 3247 W Berteau Ave
- 4027 N Troy St
- 4155 N Bernard St Unit G
- 3350 W Grace St Unit 3
- 4141 N Kedzie Ave Unit 307
- 3903 N Drake Ave
- 3815 N Kedzie Ave Unit 3S
- 3300 W Irving Park Rd
- 3300 W Irving Park Rd Unit M5
- 3300 W Irving Park Rd Unit G46
- 3300 W Irving Park Rd Unit C3
- 3300 W Irving Park Rd Unit H4
- 3300 W Irving Park Rd Unit F3
- 3300 W Irving Park Rd Unit D4
- 3300 W Irving Park Rd Unit G11
- 3300 W Irving Park Rd Unit G10
- 3300 W Irving Park Rd Unit G9
- 3300 W Irving Park Rd Unit G8
- 3300 W Irving Park Rd Unit G6
- 3300 W Irving Park Rd Unit G5
- 3300 W Irving Park Rd Unit G4
- 3300 W Irving Park Rd Unit G3
- 3300 W Irving Park Rd Unit G2
- 3300 W Irving Park Rd Unit J5
- 3300 W Irving Park Rd Unit E3
- 3300 W Irving Park Rd Unit D3
- 3300 W Irving Park Rd Unit C5