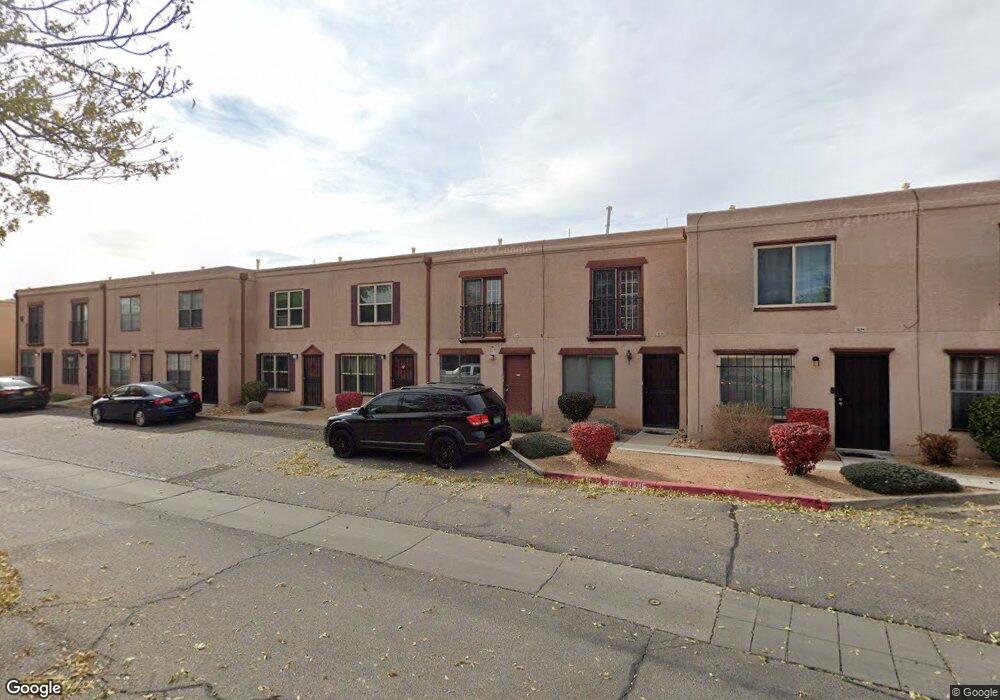
3301 Monroe St NE Unit B21 Albuquerque, NM 87110
McKinley NeighborhoodEstimated Value: $182,000 - $215,000
2
Beds
2
Baths
1,042
Sq Ft
$187/Sq Ft
Est. Value
About This Home
This home is located at 3301 Monroe St NE Unit B21, Albuquerque, NM 87110 and is currently estimated at $195,175, approximately $187 per square foot. 3301 Monroe St NE Unit B21 is a home located in Bernalillo County with nearby schools including Bel-Air Elementary School, McKinley Middle School, and Del Norte High School.
Ownership History
Date
Name
Owned For
Owner Type
Purchase Details
Closed on
Jun 20, 2014
Sold by
Proffitt David W
Bought by
Krazys Kave Dwellings Llc
Current Estimated Value
Purchase Details
Closed on
Feb 5, 2014
Sold by
Krazy S Kave Dwellings Llc
Bought by
Profitt David W
Home Financials for this Owner
Home Financials are based on the most recent Mortgage that was taken out on this home.
Original Mortgage
$65,900
Interest Rate
3.56%
Mortgage Type
New Conventional
Purchase Details
Closed on
Feb 3, 2014
Sold by
Deutsche Bank National Trust Co
Bought by
Proffitt David W
Home Financials for this Owner
Home Financials are based on the most recent Mortgage that was taken out on this home.
Original Mortgage
$65,900
Interest Rate
3.56%
Mortgage Type
New Conventional
Purchase Details
Closed on
Aug 24, 2005
Sold by
Proffitt Tina V
Bought by
Proffitt David
Purchase Details
Closed on
Aug 15, 2005
Sold by
Proffitt David W
Bought by
Proffitt Tina
Create a Home Valuation Report for This Property
The Home Valuation Report is an in-depth analysis detailing your home's value as well as a comparison with similar homes in the area
Home Values in the Area
Average Home Value in this Area
Purchase History
| Date | Buyer | Sale Price | Title Company |
|---|---|---|---|
| Krazys Kave Dwellings Llc | -- | None Available | |
| Profitt David W | -- | Fidelity Natl Title Of New M | |
| Proffitt David W | $81,600 | Fidelity Natl Title Ins Co | |
| Proffitt David | -- | None Available | |
| Proffitt Tina | $77,974 | -- |
Source: Public Records
Mortgage History
| Date | Status | Borrower | Loan Amount |
|---|---|---|---|
| Previous Owner | Proffitt David W | $65,900 | |
| Closed | Proffitt Tina | $0 |
Source: Public Records
Tax History Compared to Growth
Tax History
| Year | Tax Paid | Tax Assessment Tax Assessment Total Assessment is a certain percentage of the fair market value that is determined by local assessors to be the total taxable value of land and additions on the property. | Land | Improvement |
|---|---|---|---|---|
| 2025 | $1,365 | $33,325 | $0 | $33,325 |
| 2024 | $1,365 | $32,354 | $0 | $32,354 |
| 2023 | $1,342 | $31,412 | $0 | $31,412 |
| 2022 | $1,297 | $30,497 | $0 | $30,497 |
| 2021 | $1,291 | $30,497 | $0 | $30,497 |
| 2020 | $1,295 | $30,197 | $0 | $30,197 |
| 2019 | $1,314 | $30,630 | $0 | $30,630 |
| 2018 | $1,305 | $30,630 | $0 | $30,630 |
| 2017 | $1,320 | $30,630 | $0 | $30,630 |
| 2016 | $1,320 | $31,030 | $0 | $31,030 |
| 2015 | $31,464 | $31,464 | $0 | $31,464 |
| 2014 | $1,186 | $27,918 | $0 | $27,918 |
| 2013 | -- | $0 | $0 | $0 |
Source: Public Records
Map
Nearby Homes
- 3301 Monroe St NE Unit N145
- 3119 Truman St NE
- 3010 Quincy St NE
- 2930 Jefferson St NE
- 5001 Comanche Rd NE
- 2904 Washington St NE
- 4513 San Andres Ave NE
- 2819 Montclaire Dr NE
- 3417 Palomas Dr NE
- 3014 Aliso Dr NE
- 3026 Aliso Dr NE
- 3810 Veranda Rd NE
- 3125 Cuervo Dr NE
- 3001 Aliso Dr NE
- 3812 Comanche Rd NE
- 2826 La Veta Dr NE
- 5001 Douglas MacArthur Rd NE
- 3706 Veranda Rd NE
- 4109 Delamar Ave NE
- 3312 Alvarado Dr NE
- 3301 Monroe St NE Unit P172
- 3301 Monroe St NE Unit J106
- 3301 Monroe St NE Unit M137
- 3301 Monroe St NE Unit H83
- 3301 Monroe St NE Unit Q176
- 3301 Monroe St NE Unit K118
- 3301 Monroe St NE Unit A5
- 3301 Monroe St NE Unit I97
- 3301 Monroe St NE Unit A4
- 3301 Monroe St NE Unit J104
- 3301 Monroe St NE Unit B15
- 3301 Monroe St NE Unit C26
- 3301 Monroe St NE Unit H90
- 3301 Monroe St NE Unit D39
- 3301 Monroe St NE Unit C25
- 3301 Monroe St NE Unit P162
- 3301 Monroe St NE Unit O152
- 3301 Monroe St NE Unit P166
- 3301 Monroe St NE Unit D40
- 3301 Monroe St NE Unit J102