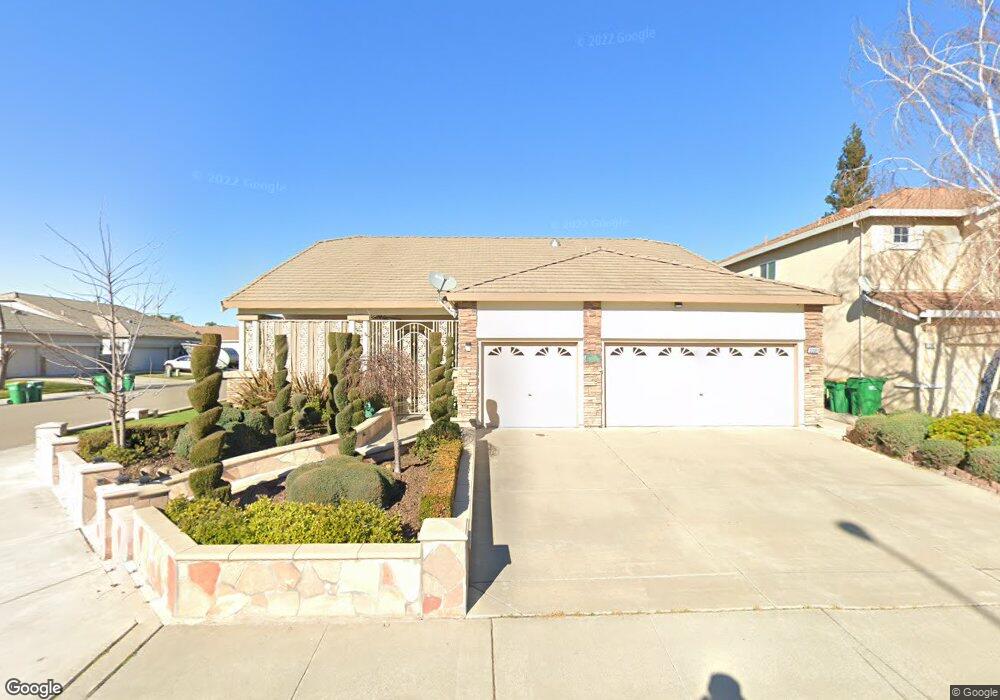
3301 Tenaya Ln Unit 7 Stockton, CA 95212
Valley Oak NeighborhoodEstimated Value: $488,000 - $541,000
3
Beds
2
Baths
2,188
Sq Ft
$238/Sq Ft
Est. Value
About This Home
This home is located at 3301 Tenaya Ln Unit 7, Stockton, CA 95212 and is currently estimated at $520,756, approximately $238 per square foot. 3301 Tenaya Ln Unit 7 is a home located in San Joaquin County with nearby schools including Ansel Adams School, Morada Middle School, and Ronald E. McNair High School.
Ownership History
Date
Name
Owned For
Owner Type
Purchase Details
Closed on
Mar 7, 2016
Sold by
Reina John T and Reina Anthonette
Bought by
The Reina Family Trust and Reina Anthonette
Current Estimated Value
Home Financials for this Owner
Home Financials are based on the most recent Mortgage that was taken out on this home.
Original Mortgage
$450,000
Outstanding Balance
$350,998
Interest Rate
3.22%
Mortgage Type
Reverse Mortgage Home Equity Conversion Mortgage
Estimated Equity
$169,758
Purchase Details
Closed on
Aug 25, 2003
Sold by
Reina John T and Reina Anthonette
Bought by
Reina John T and Reina Anthonette
Purchase Details
Closed on
Nov 18, 2002
Sold by
Reina John T and Reina Anthonette
Bought by
Reina John T and Reina Anthonette
Purchase Details
Closed on
Oct 24, 2001
Sold by
Woodside Morada Inc
Bought by
Reina John and Reina Anthonette
Home Financials for this Owner
Home Financials are based on the most recent Mortgage that was taken out on this home.
Original Mortgage
$150,000
Interest Rate
6.87%
Create a Home Valuation Report for This Property
The Home Valuation Report is an in-depth analysis detailing your home's value as well as a comparison with similar homes in the area
Home Values in the Area
Average Home Value in this Area
Purchase History
| Date | Buyer | Sale Price | Title Company |
|---|---|---|---|
| The Reina Family Trust | -- | Placer Title Company | |
| Reina John T | -- | -- | |
| Reina John T | -- | -- | |
| Reina John T | -- | -- | |
| Reina John | $250,500 | First American Title Co |
Source: Public Records
Mortgage History
| Date | Status | Borrower | Loan Amount |
|---|---|---|---|
| Open | The Reina Family Trust | $450,000 | |
| Previous Owner | Reina John | $150,000 |
Source: Public Records
Tax History Compared to Growth
Tax History
| Year | Tax Paid | Tax Assessment Tax Assessment Total Assessment is a certain percentage of the fair market value that is determined by local assessors to be the total taxable value of land and additions on the property. | Land | Improvement |
|---|---|---|---|---|
| 2025 | $4,182 | $313,773 | $77,991 | $235,782 |
| 2024 | $4,105 | $307,621 | $76,462 | $231,159 |
| 2023 | $4,040 | $301,590 | $74,963 | $226,627 |
| 2022 | $3,905 | $295,678 | $73,494 | $222,184 |
| 2021 | $3,962 | $289,881 | $72,053 | $217,828 |
| 2020 | $3,926 | $286,910 | $71,315 | $215,595 |
| 2019 | $3,799 | $281,285 | $69,917 | $211,368 |
| 2018 | $3,730 | $275,771 | $68,547 | $207,224 |
| 2017 | $3,623 | $270,364 | $67,203 | $203,161 |
| 2016 | $3,494 | $265,063 | $65,885 | $199,178 |
| 2015 | $3,499 | $261,081 | $64,895 | $196,186 |
| 2014 | $3,362 | $248,000 | $74,000 | $174,000 |
Source: Public Records
Map
Nearby Homes
- 3484 Cathedral Cir
- 9253 Bridalveil Cir
- 8916 Fox Creek Dr
- 9126 Verdicchio Ct
- 8837 Fox Creek Dr Unit 1
- 8904 Fox Creek Dr Unit 84
- 8061 Shay Cir
- 9308 Pioneer Cir
- 8169 Shay Cir
- 9042 Chianti Cir
- 9332 Kirkby Ln
- 8517 Kenny Ct
- 9321 Kirkby Ln
- 2619 Claridge Ln
- 8007 Lorraine Ave
- 9314 Cherbourg Way
- 3069 Nicoletta Ln
- 4320 Christian Life Way
- 2270 Ringwood Ave
- 7849 Moreland St
- 3307 Tenaya Ln
- 3308 Le Conte Ct
- 3315 Tenaya Ln
- 3320 Le Conte Ct
- 8715 Laughlin Ave
- 8723 Laughlin Ave
- 3332 Le Conte Ct
- 8731 Laughlin Ave
- 3302 Tenaya Ln
- 3248 Tenaya Ln
- 3323 Tenaya Ln
- 3310 Tenaya Ln
- 3236 Tenaya Ln
- 8739 Laughlin Ave
- 3344 Le Conte Ct
- 3221 Tenaya Ln
- 3230 Tenaya Ln
- 3331 Tenaya Ln
- 8803 Laughlin Ave
- 3356 Le Conte Ct