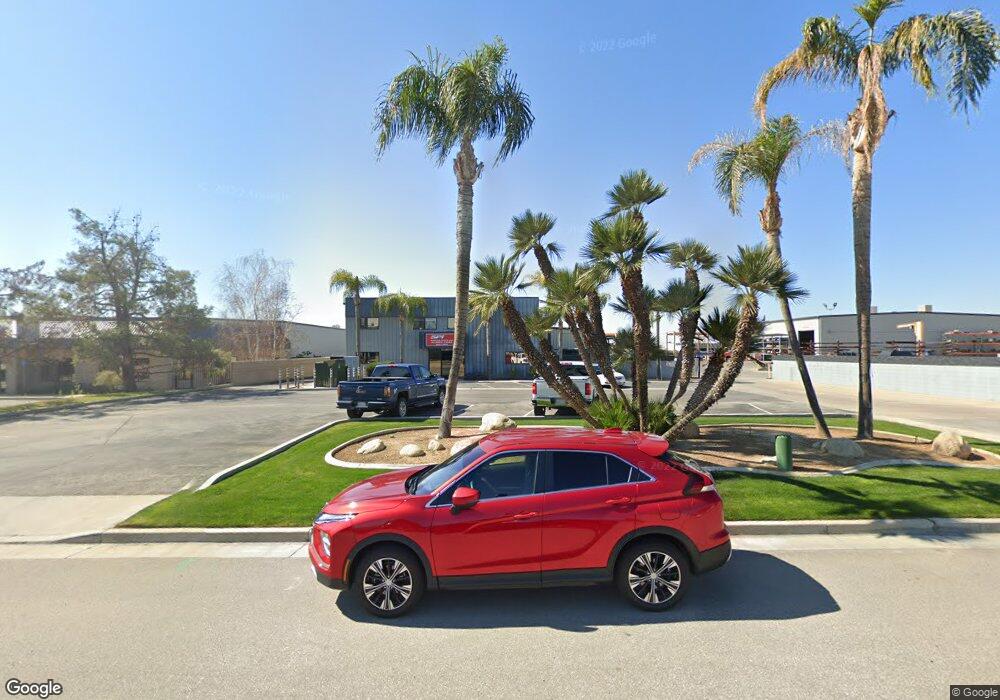
3301 Unicorn Rd Bakersfield, CA 93308
Estimated Value: $3,903,232
Studio
--
Bath
21,880
Sq Ft
$178/Sq Ft
Est. Value
About This Home
This home is located at 3301 Unicorn Rd, Bakersfield, CA 93308 and is currently estimated at $3,903,232, approximately $178 per square foot. 3301 Unicorn Rd is a home located in Kern County with nearby schools including North Beardsley Elementary School, Beardsley Junior High School, and North High School.
Ownership History
Date
Name
Owned For
Owner Type
Purchase Details
Closed on
Jun 16, 2008
Sold by
Crabco Investments
Bought by
Ryander Investments Llc
Current Estimated Value
Home Financials for this Owner
Home Financials are based on the most recent Mortgage that was taken out on this home.
Original Mortgage
$1,650,000
Outstanding Balance
$1,056,089
Interest Rate
6%
Estimated Equity
$2,847,143
Purchase Details
Closed on
Dec 14, 2005
Sold by
Palla Rodney J and Palla Cheryl M
Bought by
Crabco Investments
Purchase Details
Closed on
Mar 24, 2004
Sold by
Sapphire Properties Inc
Bought by
Palla Rodney J and Palla Cheryl M
Purchase Details
Closed on
Oct 10, 2003
Sold by
Deberti Doug L and Deberti Sandye R
Bought by
Sapphire Properties Inc
Purchase Details
Closed on
Dec 10, 2001
Sold by
Deberti Doug and Deberti Sandye
Bought by
Deberti Doug L and Deberti Sandye R
Purchase Details
Closed on
Mar 20, 1996
Sold by
Antonio & Fowler Development Services
Bought by
Deberti Doug and Deberti Sandye
Home Financials for this Owner
Home Financials are based on the most recent Mortgage that was taken out on this home.
Original Mortgage
$506,700
Interest Rate
6.98%
Mortgage Type
Small Business Administration
Create a Home Valuation Report for This Property
The Home Valuation Report is an in-depth analysis detailing your home's value as well as a comparison with similar homes in the area
Purchase History
| Date | Buyer | Sale Price | Title Company |
|---|---|---|---|
| Ryander Investments Llc | $1,950,000 | Ticor Title Company Of Ca | |
| Crabco Investments | -- | Public | |
| Palla Rodney J | $1,697,500 | -- | |
| Sapphire Properties Inc | $1,695,000 | Commonwealth Title | |
| Deberti Doug L | -- | -- | |
| Deberti Doug | $475,000 | First American Title Ins Co |
Source: Public Records
Mortgage History
| Date | Status | Borrower | Loan Amount |
|---|---|---|---|
| Open | Ryander Investments Llc | $1,650,000 | |
| Previous Owner | Deberti Doug | $506,700 |
Source: Public Records
Tax History
| Year | Tax Paid | Tax Assessment Tax Assessment Total Assessment is a certain percentage of the fair market value that is determined by local assessors to be the total taxable value of land and additions on the property. | Land | Improvement |
|---|---|---|---|---|
| 2025 | $29,786 | $2,511,131 | $566,610 | $1,944,521 |
| 2024 | $29,385 | $2,461,894 | $555,500 | $1,906,394 |
| 2023 | $29,385 | $2,413,622 | $544,608 | $1,869,014 |
| 2022 | $29,045 | $2,366,297 | $533,930 | $1,832,367 |
| 2021 | $29,018 | $2,319,900 | $523,461 | $1,796,439 |
| 2020 | $28,553 | $2,296,113 | $518,094 | $1,778,019 |
| 2019 | $28,356 | $2,296,113 | $518,094 | $1,778,019 |
| 2018 | $27,561 | $2,206,954 | $497,977 | $1,708,977 |
| 2017 | $27,212 | $2,163,681 | $488,213 | $1,675,468 |
| 2016 | $25,355 | $2,121,257 | $478,641 | $1,642,616 |
| 2015 | $24,507 | $2,089,395 | $471,452 | $1,617,943 |
| 2014 | $23,862 | $2,048,467 | $462,217 | $1,586,250 |
Source: Public Records
Map
Nearby Homes
- 6918 Crestwood St
- 6712 Noah Ave
- 6417 Sultry Rose Ct
- 6200 Wright Ave
- 7712 Jensen Ave
- 7309 Cedarcrest Ave
- 6524 Mohawk St
- 7919 Scarlet Maple Ct
- 6710 Pinedale Ct
- 6317 Tallman Ave
- 6300 Carter Ave
- 8502 Jean Anne St
- 6413 Gina Ct
- 8602 Littleton St
- 5551 Midsummer Dr Unit E
- 6009 Carter Ave
- 6001 Carter Ave
- 7524 Ruthburg Way
- 7516 Ruthburg Way
- 7605 Penny Marie Ave
- 3235 Unicorn Rd
- 3400 Unicorn Rd
- 2353 Cepheus Ct
- 2314 Perseus Ct
- 3801 Pegasus Dr
- 8740 Spectrum Park Way
- 8740 Spectrum Park Way
- 3023 Unicorn Rd
- 2301 Perseus Ct
- 2246 Orpheus Ct
- 2254 Orpheus Ct
- 2236 Orpheus Ct
- 3335 Pegasus Dr
- 3600 Pegasus Dr Unit 15
- 3600 Pegasus Dr Unit 16
- 3600 Pegasus Dr Unit 4
- 3600 Pegasus Dr Unit 10
- 3600 Pegasus Dr Unit 14
- 3600 Pegasus Dr Unit 12
- 3600 Pegasus Dr Unit 12
Your Personal Tour Guide
Ask me questions while you tour the home.