
Seller's Agent in 2024
Rod Adams
Equity Oregon Real Estate
(503) 984-0950
62 Total Sales

Estimated Value: $421,000 - $582,000
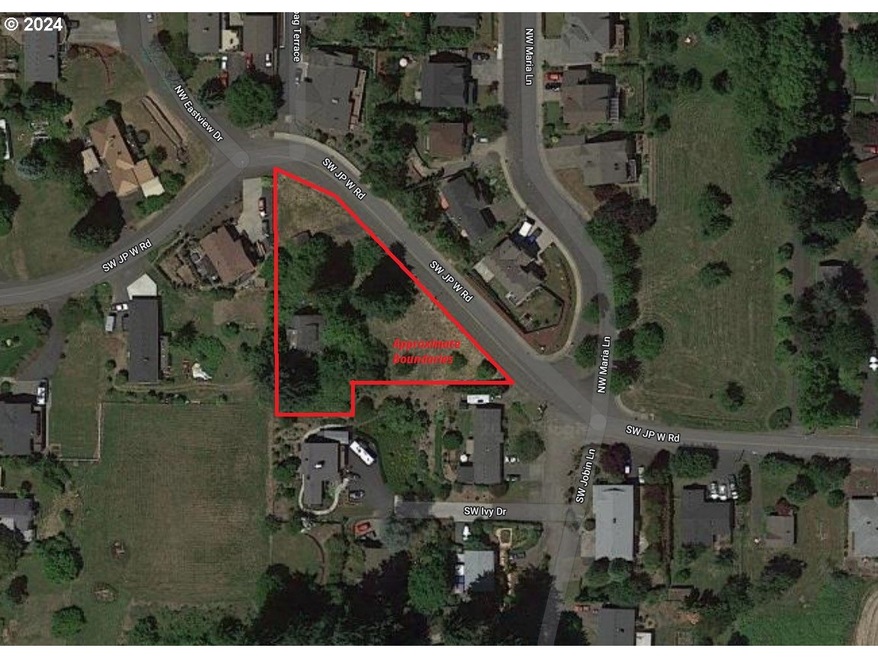
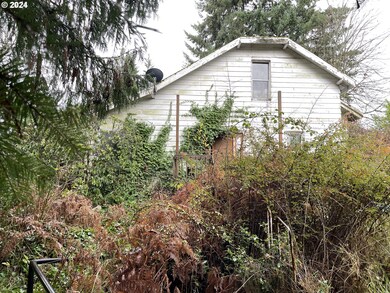
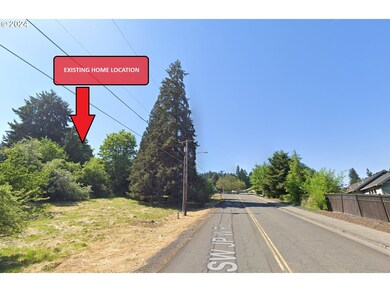
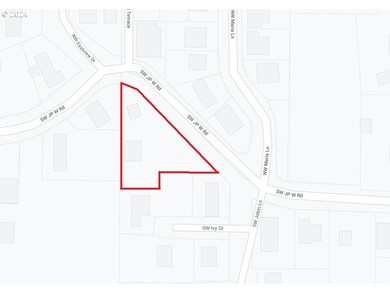
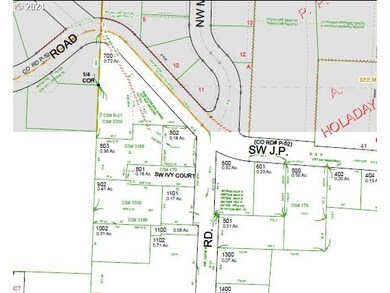
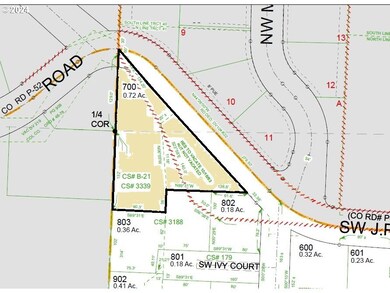
.72 AC Development Property with no value in existing home or carport. Excellent location within Scappoose City limits. Currently zoned R-1. Drive by only with access provided upon acceptance of offer with viewing contingency.
Last Agent to Sell the Property
Equity Oregon Real Estate License #200111040 Listed on: 01/26/2024
| Date | Buyer | Sale Price | Title Company |
|---|---|---|---|
| Ohm Equity Partners Llc | $275,000 | Chicago Title | |
| Rogers David Wayne | -- | None Listed On Document | |
| Rogers David W | $140,000 | -- |
| Date | Status | Borrower | Loan Amount |
|---|---|---|---|
| Closed | Ohm Equity Partners Llc | $382,500 |
| Date | Event | Price | List to Sale | Price per Sq Ft |
|---|---|---|---|---|
| 02/16/2024 02/16/24 | Sold | $275,000 | +10.0% | $139 / Sq Ft |
| 01/28/2024 01/28/24 | Pending | -- | -- | -- |
| 01/26/2024 01/26/24 | For Sale | $249,900 | -- | $126 / Sq Ft |
| Year | Tax Paid | Tax Assessment Tax Assessment Total Assessment is a certain percentage of the fair market value that is determined by local assessors to be the total taxable value of land and additions on the property. | Land | Improvement |
|---|---|---|---|---|
| 2025 | $3,807 | $231,190 | $141,780 | $89,410 |
| 2024 | $3,701 | $224,460 | $137,650 | $86,810 |
| 2023 | $3,667 | $217,930 | $131,800 | $86,130 |
| 2022 | $3,512 | $211,590 | $127,960 | $83,630 |
| 2021 | $3,412 | $205,430 | $125,870 | $79,560 |
| 2020 | $3,164 | $199,450 | $119,110 | $80,340 |
| 2019 | $3,082 | $193,650 | $114,930 | $78,720 |
| 2018 | $3,011 | $188,010 | $127,550 | $60,460 |
| 2017 | $2,957 | $182,540 | $123,840 | $58,700 |
| 2016 | $2,920 | $177,230 | $120,240 | $56,990 |
| 2015 | $2,569 | $163,520 | $117,640 | $45,880 |
| 2014 | $2,398 | $151,990 | $102,250 | $49,740 |
Seller's Agent in 2024
Rod Adams
Equity Oregon Real Estate
(503) 984-0950
62 Total Sales
V
Seller Co-Listing Agent in 2024
Vince Pavlicek
Equity Oregon Real Estate
(503) 266-2546
46 Total Sales
Buyer's Agent in 2024
Jeff Yarbor
Keller Williams Sunset Corridor
(971) 706-4054
80 Total Sales
Source: Regional Multiple Listing Service (RMLS)
MLS Number: 24552063
APN: 0101032120320070000
Disclaimer: Certain information contained herein is derived from information provided by parties other than Homes.com. All information provided is deemed reliable, but is not guaranteed to be accurate and should be independently verified.
![]() The content relating to real estate for sale on this web site comes in part from the IDX program of the RMLS™ of Portland, Oregon. Real estate listings held by brokerage firms other than Ten-X are marked with the RMLS™ logo, and detailed information about these properties includes the names of the listing brokers. Listing content is copyright © 2025 RMLS™, Portland, Oregon. Some properties which appear for sale on this web site may subsequently have sold or may no longer be available. All information provided is deemed reliable but is not guaranteed and should be independently verified.
The content relating to real estate for sale on this web site comes in part from the IDX program of the RMLS™ of Portland, Oregon. Real estate listings held by brokerage firms other than Ten-X are marked with the RMLS™ logo, and detailed information about these properties includes the names of the listing brokers. Listing content is copyright © 2025 RMLS™, Portland, Oregon. Some properties which appear for sale on this web site may subsequently have sold or may no longer be available. All information provided is deemed reliable but is not guaranteed and should be independently verified.