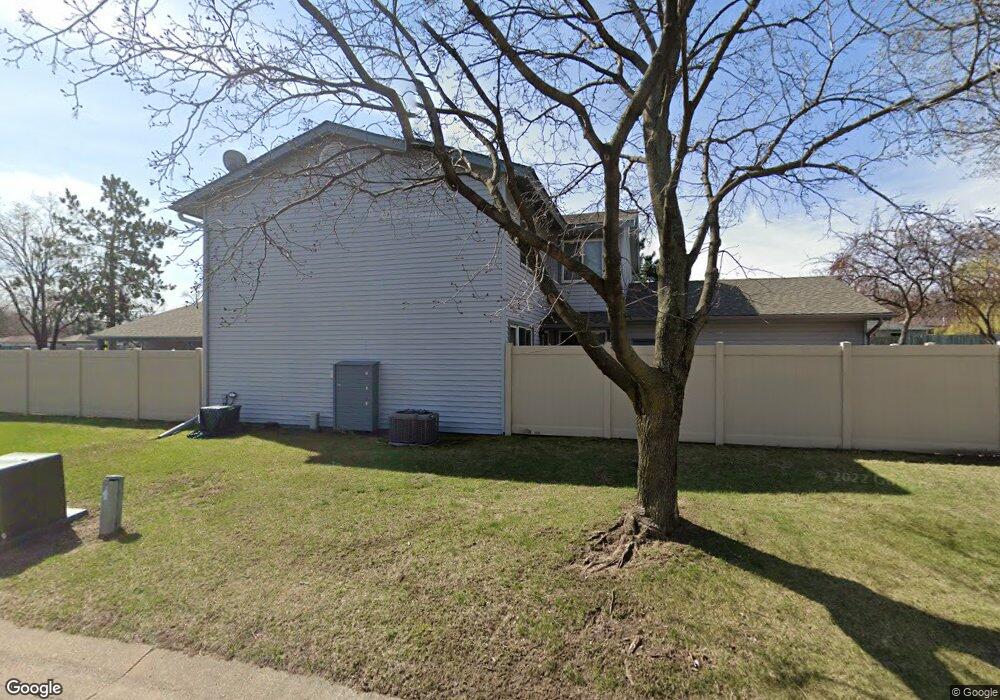
3302 Lower 67th St E Unit 37 Inver Grove Heights, MN 55076
Estimated Value: $162,000 - $193,000
2
Beds
1
Bath
962
Sq Ft
$187/Sq Ft
Est. Value
About This Home
This home is located at 3302 Lower 67th St E Unit 37, Inver Grove Heights, MN 55076 and is currently estimated at $180,074, approximately $187 per square foot. 3302 Lower 67th St E Unit 37 is a home located in Dakota County with nearby schools including Hilltop Elementary School, Inver Grove Heights Middle School, and Simley Senior High School.
Ownership History
Date
Name
Owned For
Owner Type
Purchase Details
Closed on
Sep 22, 2016
Sold by
Federal Home Loan Mortgage Corporation
Bought by
Steven Douglas M and Steven Tammy L
Current Estimated Value
Home Financials for this Owner
Home Financials are based on the most recent Mortgage that was taken out on this home.
Original Mortgage
$63,675
Outstanding Balance
$40,336
Interest Rate
3.45%
Mortgage Type
New Conventional
Estimated Equity
$139,738
Purchase Details
Closed on
Dec 1, 2015
Sold by
Wells Fargo Bank Na
Bought by
Federal Home Loan Mortgage Corporation
Purchase Details
Closed on
May 27, 2015
Sold by
Brown Sandra J
Bought by
Wells Fargo Bank Na
Purchase Details
Closed on
Oct 27, 2000
Sold by
Fleming John and Fleming Jill
Bought by
Brown Sandra J
Create a Home Valuation Report for This Property
The Home Valuation Report is an in-depth analysis detailing your home's value as well as a comparison with similar homes in the area
Home Values in the Area
Average Home Value in this Area
Purchase History
| Date | Buyer | Sale Price | Title Company |
|---|---|---|---|
| Steven Douglas M | -- | Attorney | |
| Federal Home Loan Mortgage Corporation | -- | None Available | |
| Wells Fargo Bank Na | $56,932 | None Available | |
| Brown Sandra J | $97,000 | -- |
Source: Public Records
Mortgage History
| Date | Status | Borrower | Loan Amount |
|---|---|---|---|
| Open | Steven Douglas M | $63,675 |
Source: Public Records
Tax History Compared to Growth
Tax History
| Year | Tax Paid | Tax Assessment Tax Assessment Total Assessment is a certain percentage of the fair market value that is determined by local assessors to be the total taxable value of land and additions on the property. | Land | Improvement |
|---|---|---|---|---|
| 2024 | $1,646 | $160,900 | $24,700 | $136,200 |
| 2023 | $1,646 | $158,300 | $24,900 | $133,400 |
| 2022 | $1,556 | $155,500 | $24,900 | $130,600 |
| 2021 | $1,444 | $138,500 | $21,600 | $116,900 |
| 2020 | $1,370 | $126,400 | $20,600 | $105,800 |
| 2019 | $1,362 | $119,300 | $19,600 | $99,700 |
| 2018 | $1,265 | $110,300 | $18,100 | $92,200 |
| 2017 | $1,188 | $101,700 | $16,800 | $84,900 |
| 2016 | $773 | $93,700 | $16,000 | $77,700 |
| 2015 | $839 | $57,808 | $10,077 | $47,731 |
| 2014 | -- | $59,443 | $9,382 | $50,061 |
| 2013 | -- | $51,704 | $8,174 | $43,530 |
Source: Public Records
Map
Nearby Homes
- 3481 Cloman Way E
- 6951 Clay Ave
- 3548 Cloman Way
- 3568 Cloman Way
- TBD 65th St E
- 7134 Claude Ave
- 6280 Carleda Way
- 6445 Coryell Ct
- 7169 Clay Ave
- 3902 67th St E
- 6050 Cahill Ave
- 7393 Clayton Ave
- Virginia Plan at Eagles Landing
- Cottonwood II Plan at Eagles Landing
- Enclave II Plan at Eagles Landing
- Macalaster Plan at Eagles Landing
- Bismarck Plan at Eagles Landing
- Tennessee Plan at Eagles Landing
- St James Plan at Eagles Landing
- Everleigh Plan at Eagles Landing
- 3302 Lower 67th St E Unit 3302
- 3310 Lower 67th St E
- 3300 Lower 67th St E
- 3312 Lower 67th St E Unit 39
- 3312 Lower 67th St E
- 3311 Lower 67th St E
- 3315 Lower 67th St E
- 3317 Lower 67th St E Unit 8
- 3320 Lower 67th St E Unit 42
- 3322 Lower 67th St E
- 6711 Catherine Ave
- 6711 Catherine Ave Unit 43
- 6709 Catherine Ave Unit 44
- 3291 Lower 67th St E Unit 19
- 3291 Lower 67th St E
- 3293 Lower 67th St E
- 3281 Cloman Way
- 3279 Cloman Way Unit 23
- 3291 Cloman Way
- 3289 Cloman Way Unit 21