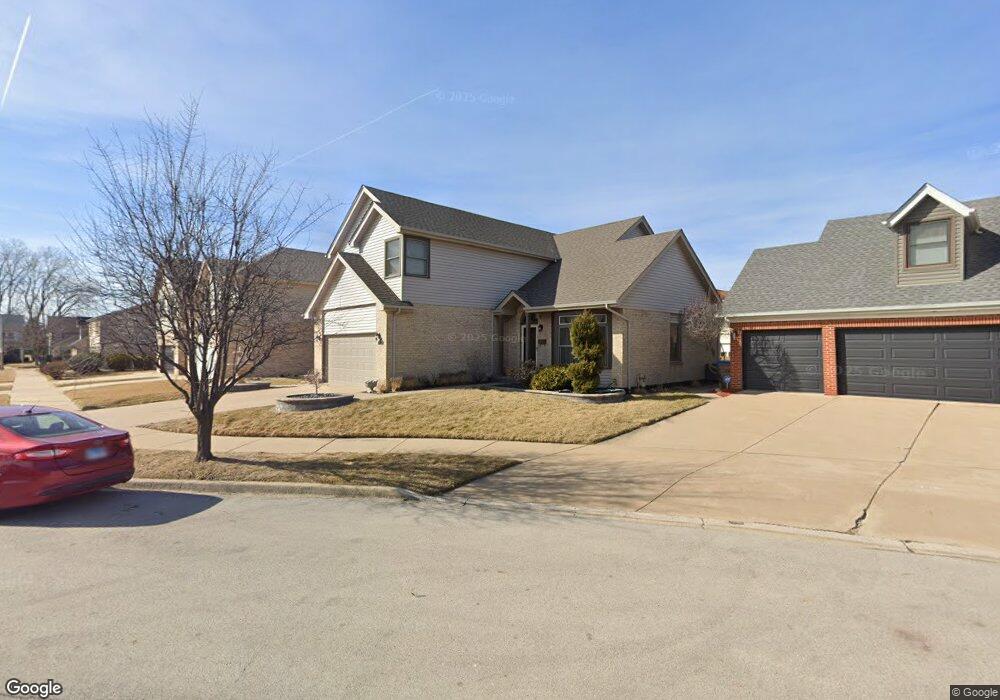
3302 W 86th St Chicago, IL 60652
Ashburn NeighborhoodEstimated Value: $382,174 - $443,000
4
Beds
3
Baths
2,469
Sq Ft
$164/Sq Ft
Est. Value
About This Home
This home is located at 3302 W 86th St, Chicago, IL 60652 and is currently estimated at $403,725, approximately $163 per square foot. 3302 W 86th St is a home located in Cook County with nearby schools including Carroll-Rosenwald Elementary School - Carroll Campus, Bogan Computer Technical High School, and CICS - Wrightwood.
Ownership History
Date
Name
Owned For
Owner Type
Purchase Details
Closed on
Oct 6, 2014
Sold by
Pettis Christopher
Bought by
Pettis Christopher and Brady Letina K
Current Estimated Value
Purchase Details
Closed on
Jul 8, 2014
Sold by
Hassan Theodore and Hurston Patricia
Bought by
Pettis Christopher
Home Financials for this Owner
Home Financials are based on the most recent Mortgage that was taken out on this home.
Original Mortgage
$289,580
Outstanding Balance
$218,151
Interest Rate
3.87%
Mortgage Type
FHA
Estimated Equity
$185,574
Purchase Details
Closed on
Jul 18, 1994
Sold by
Chicago Title & Trust Company
Bought by
Hassan Theodore and Hurston Patricia
Home Financials for this Owner
Home Financials are based on the most recent Mortgage that was taken out on this home.
Original Mortgage
$196,800
Interest Rate
8.62%
Mortgage Type
Purchase Money Mortgage
Create a Home Valuation Report for This Property
The Home Valuation Report is an in-depth analysis detailing your home's value as well as a comparison with similar homes in the area
Home Values in the Area
Average Home Value in this Area
Purchase History
| Date | Buyer | Sale Price | Title Company |
|---|---|---|---|
| Pettis Christopher | -- | None Available | |
| Pettis Christopher | $295,000 | None Available | |
| Hassan Theodore | $247,000 | -- |
Source: Public Records
Mortgage History
| Date | Status | Borrower | Loan Amount |
|---|---|---|---|
| Open | Pettis Christopher | $289,580 | |
| Previous Owner | Hassan Theodore | $196,800 |
Source: Public Records
Tax History Compared to Growth
Tax History
| Year | Tax Paid | Tax Assessment Tax Assessment Total Assessment is a certain percentage of the fair market value that is determined by local assessors to be the total taxable value of land and additions on the property. | Land | Improvement |
|---|---|---|---|---|
| 2024 | $5,208 | $33,000 | $2,693 | $30,307 |
| 2023 | $5,055 | $28,000 | $3,590 | $24,410 |
| 2022 | $5,055 | $28,000 | $3,590 | $24,410 |
| 2021 | $4,961 | $27,999 | $3,590 | $24,409 |
| 2020 | $5,103 | $26,010 | $3,590 | $22,420 |
| 2019 | $5,118 | $28,901 | $3,590 | $25,311 |
| 2018 | $5,709 | $28,901 | $3,590 | $25,311 |
| 2017 | $6,298 | $29,254 | $3,141 | $26,113 |
| 2016 | $5,859 | $29,254 | $3,141 | $26,113 |
| 2015 | $5,361 | $29,254 | $3,141 | $26,113 |
| 2014 | $4,656 | $25,095 | $2,917 | $22,178 |
| 2013 | $4,564 | $25,095 | $2,917 | $22,178 |
Source: Public Records
Map
Nearby Homes
- 3101 W 87th St
- 3237 W 83rd Place
- 8738 S Troy Ave
- 3442 W 84th St
- 3158 W 88th St Unit 103
- 8753 S Troy Ave
- 3030 W 85th St
- 8821 S Troy Ave
- 3011 W 87th St
- 3614 W 86th Place
- 8834 S Albany Ave
- 8223 S Sawyer Ave
- 8701 S Sacramento Ave Unit 2NW
- 3630 W 86th Place
- 3631 W 86th Place
- 8242 S Albany Ave
- 8230 S Albany Ave
- 8841 S Utica Ave
- 8118 S Spaulding Ave
- 8825 S Richmond Ave
- 3318 W 86th St
- 3304 W 86th St
- 3309 W 85th Place
- 3322 W 86th St
- 3315 W 85th Place
- 3301 W 85th Place
- 3319 W 85th Place
- 3265 W 85th Place
- 3261 W 85th Place
- 8543 S Christiana Ave
- 8547 S Christiana Ave
- 8539 S Christiana Ave
- 3254 W 86th St
- 8535 S Christiana Ave
- 3255 W 85th Place
- 3310 W 85th Place
- 3251 W 85th Place
- 3306 W 85th Place
- 3314 W 85th Place
- 3302 W 85th Place