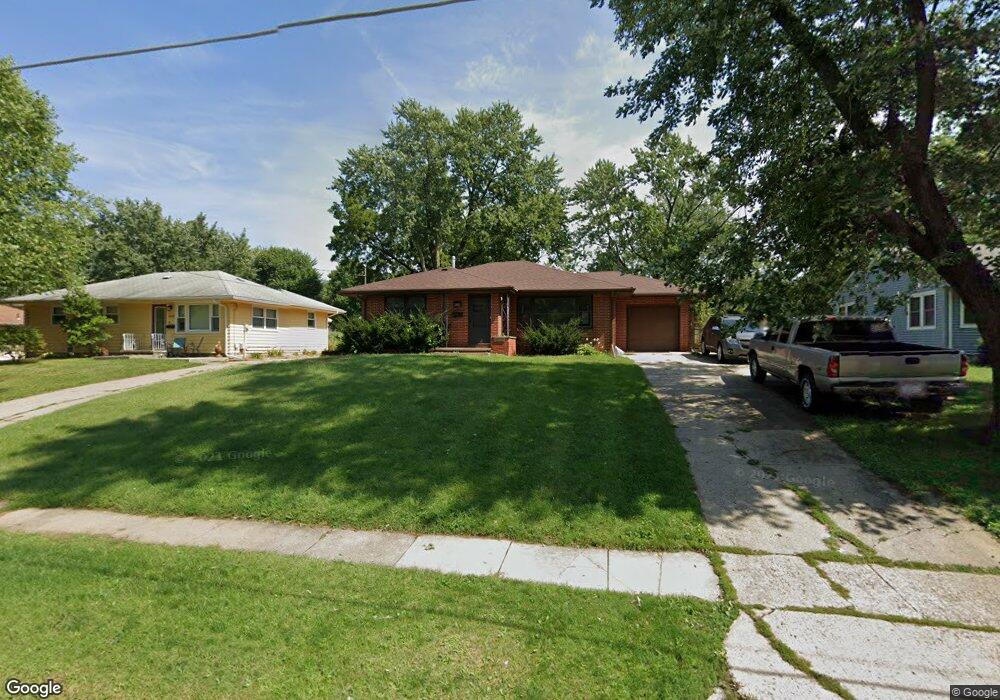
3303 62nd St Des Moines, IA 50322
Merle Hay NeighborhoodEstimated Value: $231,000 - $254,000
3
Beds
1
Bath
1,160
Sq Ft
$209/Sq Ft
Est. Value
About This Home
This home is located at 3303 62nd St, Des Moines, IA 50322 and is currently estimated at $242,622, approximately $209 per square foot. 3303 62nd St is a home located in Polk County with nearby schools including Moore Elementary School, Meredith Middle School, and Hoover High School.
Ownership History
Date
Name
Owned For
Owner Type
Purchase Details
Closed on
May 12, 2008
Sold by
Berg Philip L and Berg Kara J
Bought by
Harn Edward J and Peden Patricia
Current Estimated Value
Home Financials for this Owner
Home Financials are based on the most recent Mortgage that was taken out on this home.
Original Mortgage
$147,000
Outstanding Balance
$93,264
Interest Rate
6%
Mortgage Type
Purchase Money Mortgage
Estimated Equity
$149,358
Purchase Details
Closed on
May 24, 2000
Sold by
Wheeler Ronald L and Wheeler Paulette
Bought by
Berg Philip L and Berg Kara J
Home Financials for this Owner
Home Financials are based on the most recent Mortgage that was taken out on this home.
Original Mortgage
$112,200
Interest Rate
8.5%
Purchase Details
Closed on
Mar 18, 1998
Sold by
Wheeler Deborah A
Bought by
Wheeler Ronald L
Home Financials for this Owner
Home Financials are based on the most recent Mortgage that was taken out on this home.
Original Mortgage
$75,000
Interest Rate
7.14%
Create a Home Valuation Report for This Property
The Home Valuation Report is an in-depth analysis detailing your home's value as well as a comparison with similar homes in the area
Home Values in the Area
Average Home Value in this Area
Purchase History
| Date | Buyer | Sale Price | Title Company |
|---|---|---|---|
| Harn Edward J | $146,500 | Itc | |
| Berg Philip L | $109,500 | -- | |
| Wheeler Ronald L | -- | -- |
Source: Public Records
Mortgage History
| Date | Status | Borrower | Loan Amount |
|---|---|---|---|
| Open | Harn Edward J | $147,000 | |
| Previous Owner | Berg Philip L | $112,200 | |
| Previous Owner | Wheeler Ronald L | $75,000 |
Source: Public Records
Tax History Compared to Growth
Tax History
| Year | Tax Paid | Tax Assessment Tax Assessment Total Assessment is a certain percentage of the fair market value that is determined by local assessors to be the total taxable value of land and additions on the property. | Land | Improvement |
|---|---|---|---|---|
| 2025 | $4,458 | $268,400 | $54,600 | $213,800 |
| 2024 | $4,458 | $245,700 | $49,300 | $196,400 |
| 2023 | $4,588 | $245,700 | $49,300 | $196,400 |
| 2022 | $4,550 | $206,900 | $42,900 | $164,000 |
| 2021 | $4,422 | $206,900 | $42,900 | $164,000 |
| 2020 | $4,586 | $189,100 | $39,100 | $150,000 |
| 2019 | $4,258 | $189,100 | $39,100 | $150,000 |
| 2018 | $4,208 | $170,200 | $34,500 | $135,700 |
| 2017 | $3,842 | $170,200 | $34,500 | $135,700 |
| 2016 | $3,736 | $153,800 | $30,700 | $123,100 |
| 2015 | $3,736 | $153,800 | $30,700 | $123,100 |
| 2014 | $3,620 | $153,700 | $30,100 | $123,600 |
Source: Public Records
Map
Nearby Homes