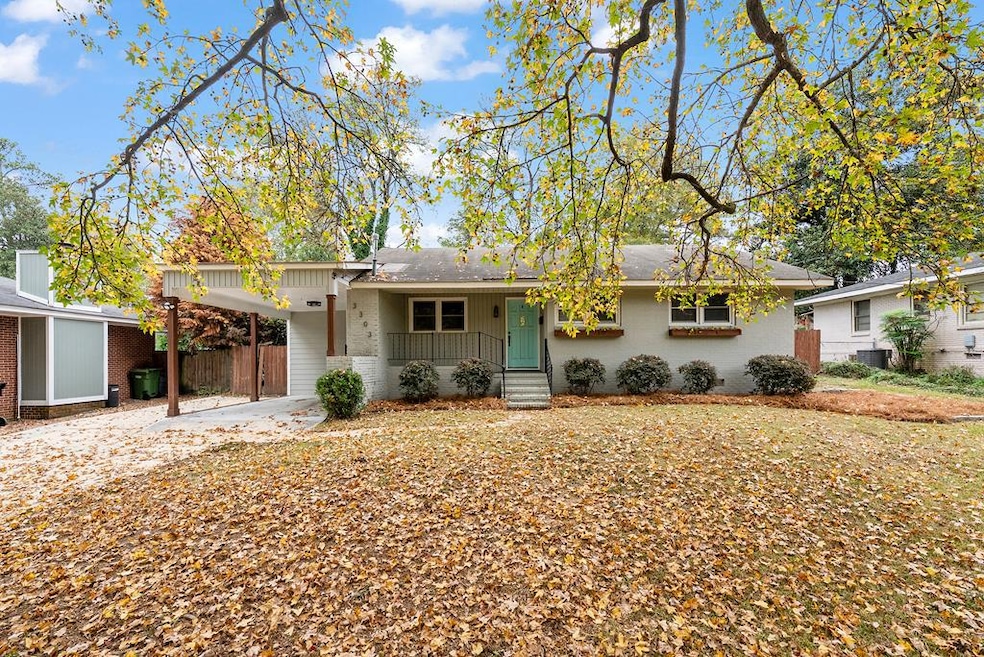
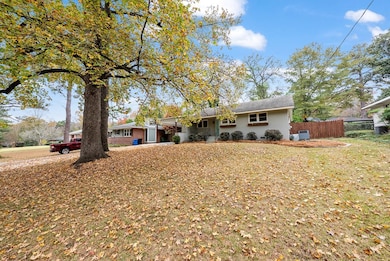
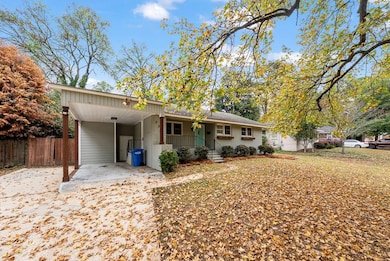
3303 Meadowbrook Dr Columbus, GA 31907
Eastern Columbus NeighborhoodEstimated payment $1,521/month
Highlights
- No HOA
- Double Vanity
- Patio
- 1 Car Attached Garage
- Cooling Available
- Laundry Room
About This Home
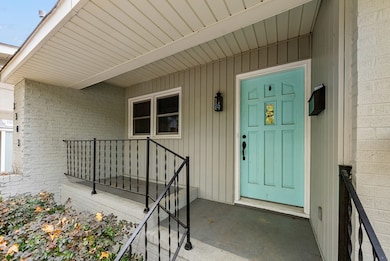
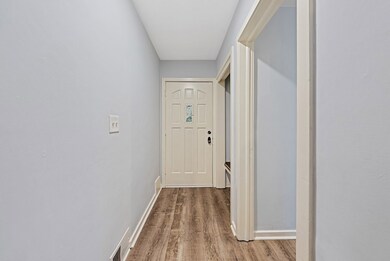
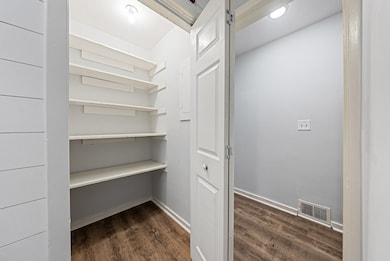
Welcome to this charming single-level 4-bedroom, 2-bath home in Midtown that is move-in ready - just in time for the Holiday Season! Step inside to find an entry foyer with custom built-in storage, an updated kitchen with contemporary finishes & stainless appliances, plus renovated bathrooms. The fenced-in backyard provides privacy and space for pets, play, or outdoor entertaining. Additional features include aluminum windows for ease & efficiency, a single carport for convenience, and LVP flooring for durability. The home is centrally located, offering an easy commute to Columbus State University, Uptown Columbus or Fort Benning! Call today to schedule your private showing!
Listing Agent
Coldwell Banker / Kennon, Parker, Duncan & Davis Brokerage Phone: 7062561000 License #361694 Listed on: 11/24/2025

Home Details
Home Type
- Single Family
Est. Annual Taxes
- $3,366
Year Built
- Built in 1951
Lot Details
- 10,890 Sq Ft Lot
- Fenced
- Landscaped
- Level Lot
Home Design
- Brick Exterior Construction
Interior Spaces
- 1,616 Sq Ft Home
- 1-Story Property
- Ceiling Fan
- Entrance Foyer
- Family Room with Fireplace
- Crawl Space
- Fire and Smoke Detector
- Laundry Room
Kitchen
- Microwave
- Dishwasher
Bedrooms and Bathrooms
- 4 Main Level Bedrooms
- 2 Full Bathrooms
- Double Vanity
Parking
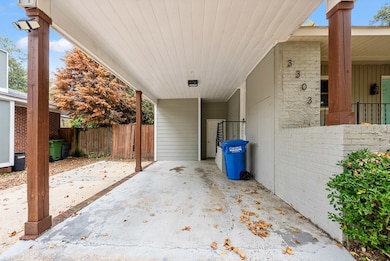
- 1 Car Attached Garage
- 1 Carport Space
Outdoor Features
- Patio
Utilities
- Cooling Available
- Forced Air Heating System
- Heating System Uses Natural Gas
- Cable TV Available
Community Details
- No Home Owners Association
- Meadowbrook Subdivision
Listing and Financial Details
- Assessor Parcel Number 068 031 005
Map
Home Values in the Area
Average Home Value in this Area
Tax History
| Year | Tax Paid | Tax Assessment Tax Assessment Total Assessment is a certain percentage of the fair market value that is determined by local assessors to be the total taxable value of land and additions on the property. | Land | Improvement |
|---|---|---|---|---|
| 2025 | $3,366 | $85,984 | $10,696 | $75,288 |
| 2024 | $3,366 | $85,984 | $10,696 | $75,288 |
| 2023 | $34 | $85,984 | $10,696 | $75,288 |
| 2022 | $2,782 | $68,124 | $10,696 | $57,428 |
| 2021 | $2,615 | $64,036 | $10,696 | $53,340 |
| 2020 | $1,897 | $46,444 | $10,696 | $35,748 |
| 2019 | $1,903 | $46,444 | $10,696 | $35,748 |
| 2018 | $1,524 | $37,200 | $9,040 | $28,160 |
| 2017 | $2,017 | $49,072 | $13,372 | $35,700 |
| 2016 | $180 | $31,991 | $4,112 | $27,879 |
| 2015 | $73 | $31,991 | $4,112 | $27,879 |
| 2014 | $73 | $31,991 | $4,112 | $27,879 |
| 2013 | -- | $31,991 | $4,112 | $27,879 |
Property History
| Date | Event | Price | List to Sale | Price per Sq Ft | Prior Sale |
|---|---|---|---|---|---|
| 11/24/2025 11/24/25 | For Sale | $234,900 | +44.6% | $145 / Sq Ft | |
| 08/18/2024 08/18/24 | Off Market | $162,500 | -- | -- | |
| 11/20/2020 11/20/20 | Sold | $162,500 | 0.0% | $101 / Sq Ft | View Prior Sale |
| 10/23/2020 10/23/20 | Pending | -- | -- | -- | |
| 10/21/2020 10/21/20 | For Sale | $162,500 | -- | $101 / Sq Ft |
Purchase History
| Date | Type | Sale Price | Title Company |
|---|---|---|---|
| Warranty Deed | $162,500 | -- | |
| Warranty Deed | $102,000 | -- | |
| Warranty Deed | -- | -- | |
| Warranty Deed | $93,000 | -- |
Mortgage History
| Date | Status | Loan Amount | Loan Type |
|---|---|---|---|
| Open | $166,237 | VA | |
| Previous Owner | $93,665 | VA |
Source: Columbus Board of REALTORS® (GA)
MLS Number: 224697
APN: 068-031-005
Disclaimer: Certain information contained herein is derived from information provided by parties other than Homes.com. All information provided is deemed reliable, but is not guaranteed to be accurate and should be independently verified.
![]() IDX information is provided exclusively for personal, non-commercial use, and may not be used for any purpose other than to identify prospective properties consumers may be interested in purchasing. Information is deemed reliable but not guaranteed.
IDX information is provided exclusively for personal, non-commercial use, and may not be used for any purpose other than to identify prospective properties consumers may be interested in purchasing. Information is deemed reliable but not guaranteed.
- 3224 Carden Dr
- 3335 Junaluska Dr
- 3337 Coweta Dr
- 3346 Junaluska Dr
- 3328 College Ave
- 3129 Avon Dr
- 3409 Hiawatha Dr
- 3200 Tip Top Dr
- 3425 Tomahawk Dr
- 3604 Norris Rd
- 2930 Sue MacK Dr
- 3402 Cambridge Dr
- 2722 E Lindsay Dr
- 2525 Norris Rd Unit 36
- 2525 Norris Rd Unit 91
- 3716 University Ave
- 2820 Nancy St
- 3515 Clubview Dr
- 2645 Edgewood Rd
- 3935 Dexter Dr
- 2860 Cromwell Dr
- 3219 University Ave Unit 7
- 3106 University Ave Unit A
- 3132 Oak Cir
- 3738 Mote Rd
- 4226 University Ave
- 4002 Armour Ave
- 3821 Armour Ave
- 3938 Edgewood Cir Unit ID1043496P
- 2840 Warm Springs Rd
- 3940 Macon Rd
- 3528 Gentian Blvd
- 3515 Gentian Blvd
- 4503 Reese Rd
- 1824-2020 Sheffield Dr
- 3828 Reese Rd
- 3561 Hilton Ave
- 1712 Marilon Dr
- 1400 Boxwood Blvd
- 4209 King Arthur Place Unit ID1043488P