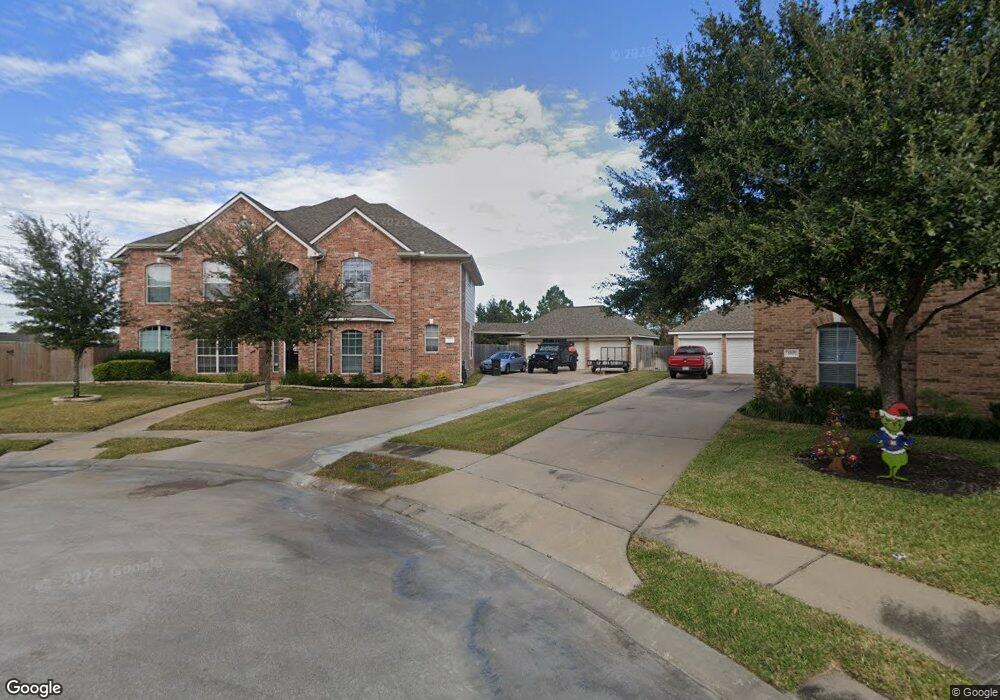
3303 Misty Glade Ct Katy, TX 77494
Southwest Cinco Ranch NeighborhoodEstimated Value: $643,000 - $702,269
6
Beds
4
Baths
4,157
Sq Ft
$163/Sq Ft
Est. Value
About This Home
This home is located at 3303 Misty Glade Ct, Katy, TX 77494 and is currently estimated at $676,317, approximately $162 per square foot. 3303 Misty Glade Ct is a home located in Fort Bend County with nearby schools including Woodcreek Elementary School, Tays Junior High, and Obra D. Tompkins High School.
Ownership History
Date
Name
Owned For
Owner Type
Purchase Details
Closed on
Oct 27, 2015
Sold by
Hernandez Ruben and Hernandez Laura
Bought by
Garrett Stephanie K and Garrett Christopher
Current Estimated Value
Home Financials for this Owner
Home Financials are based on the most recent Mortgage that was taken out on this home.
Original Mortgage
$309,600
Outstanding Balance
$244,749
Interest Rate
3.94%
Mortgage Type
New Conventional
Estimated Equity
$431,568
Purchase Details
Closed on
Feb 22, 2008
Sold by
J Patrick Homes Ltd
Bought by
Hernandez Ruben and Hernandez Laura
Home Financials for this Owner
Home Financials are based on the most recent Mortgage that was taken out on this home.
Original Mortgage
$225,200
Interest Rate
5.47%
Mortgage Type
Purchase Money Mortgage
Purchase Details
Closed on
Jul 5, 2007
Sold by
Katy 309 Venture Lp
Bought by
Garrett Stephanie K and Garrett Christopher
Create a Home Valuation Report for This Property
The Home Valuation Report is an in-depth analysis detailing your home's value as well as a comparison with similar homes in the area
Home Values in the Area
Average Home Value in this Area
Purchase History
| Date | Buyer | Sale Price | Title Company |
|---|---|---|---|
| Garrett Stephanie K | -- | Texas American Title Co | |
| Hernandez Ruben | -- | Stewart Title Co | |
| Garrett Stephanie K | -- | -- | |
| Garrett Stephanie K | -- | -- |
Source: Public Records
Mortgage History
| Date | Status | Borrower | Loan Amount |
|---|---|---|---|
| Open | Garrett Stephanie K | $309,600 | |
| Previous Owner | Garrett Stephanie K | $225,200 | |
| Previous Owner | Garrett Stephanie K | $42,200 |
Source: Public Records
Tax History Compared to Growth
Tax History
| Year | Tax Paid | Tax Assessment Tax Assessment Total Assessment is a certain percentage of the fair market value that is determined by local assessors to be the total taxable value of land and additions on the property. | Land | Improvement |
|---|---|---|---|---|
| 2025 | $10,993 | $589,727 | $102,921 | $600,950 |
| 2024 | $10,993 | $536,115 | -- | $584,114 |
| 2023 | $10,256 | $487,377 | $0 | $601,327 |
| 2022 | $10,827 | $443,070 | $0 | $504,910 |
| 2021 | $11,095 | $402,790 | $79,170 | $323,620 |
| 2020 | $11,273 | $396,660 | $79,170 | $317,490 |
| 2019 | $11,765 | $388,190 | $79,170 | $309,020 |
| 2018 | $11,395 | $367,150 | $79,170 | $287,980 |
| 2017 | $11,528 | $364,980 | $79,170 | $285,810 |
| 2016 | $10,910 | $345,400 | $79,170 | $266,230 |
| 2015 | $6,438 | $343,650 | $79,170 | $264,480 |
| 2014 | $6,022 | $312,410 | $79,170 | $233,240 |
Source: Public Records
Map
Nearby Homes
- 3418 Honey Blossom Ln
- 25815 Silver Timbers Ln
- 26507 Grey Sparrow Dr
- 26602 Green Heron Dr
- 2403 Horned Owl Dr
- 3626 Knights Hollow Ct
- 3104 Harrier Ct
- 3105 Harrier Ct
- 3618 Meandering Spring Dr
- 2522 Tompkins Reserve Dr
- 3603 Morgans Cove Ct
- Falcon Plan at Tompkins Reserve
- Martin Plan at Tompkins Reserve
- Starling Plan at Tompkins Reserve
- Verdin Plan at Tompkins Reserve
- Downy Plan at Tompkins Reserve
- Wren Plan at Tompkins Reserve
- Goldeneye Plan at Tompkins Reserve
- 25722 Oakwood Knoll Dr
- 25611 Kearsley Dr
- 3307 Misty Glade Ct
- 3306 Misty Glade Ct
- 3306 Misty Glade Ct
- 3311 Misty Glade Ct
- 3310 Misty Glade Ct
- 25915 Shady Dawn Ln
- 25914 Shady Dawn Ln
- 25930 Shady Dawn Ln
- 25919 Shady Dawn Ln
- 25911 Shady Dawn Ln
- 3402 Leaning Willow Dr
- 25910 Shady Dawn Ln
- 25934 Shady Dawn Ln
- 3406 Leaning Willow Dr
- 25923 Shady Dawn Ln
- 25818 Creek Ledge Dr
- 3410 Leaning Willow Dr
- 25918 Pebble Terrane Ln
- 26002 Shady Dawn Ln
- 26003 Shady Dawn Ln