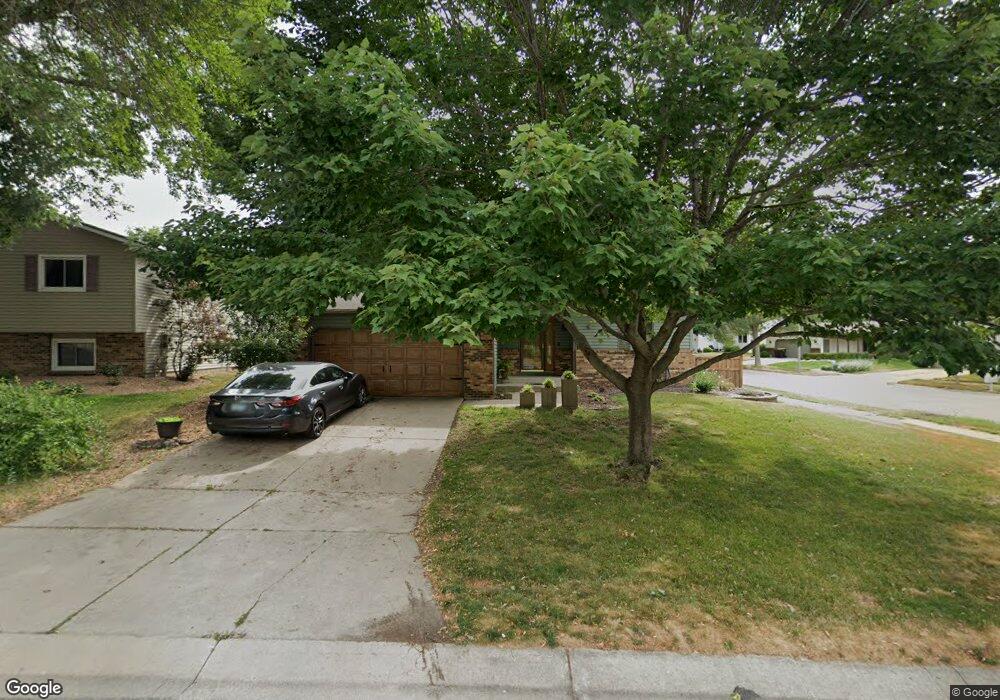
3304 8th Ln NW Rochester, MN 55901
Elton Hills NeighborhoodEstimated Value: $349,000 - $374,000
4
Beds
2
Baths
2,448
Sq Ft
$148/Sq Ft
Est. Value
About This Home
This home is located at 3304 8th Ln NW, Rochester, MN 55901 and is currently estimated at $361,233, approximately $147 per square foot. 3304 8th Ln NW is a home located in Olmsted County with nearby schools including Elton Hills Elementary School, John Adams Middle School, and John Marshall Senior High School.
Ownership History
Date
Name
Owned For
Owner Type
Purchase Details
Closed on
Sep 8, 2020
Sold by
Baukol Phillip A and Baukol Pov T
Bought by
Grantham Jennifer Renee
Current Estimated Value
Home Financials for this Owner
Home Financials are based on the most recent Mortgage that was taken out on this home.
Original Mortgage
$251,319
Outstanding Balance
$222,615
Interest Rate
2.8%
Mortgage Type
New Conventional
Estimated Equity
$138,618
Purchase Details
Closed on
Oct 21, 2011
Sold by
Baukol Phillip A and Baukol Pov T
Bought by
Baukol Phillip A and Baukol Pov T
Purchase Details
Closed on
Jun 29, 2006
Sold by
Mackie Edward M and Mackie Kaisa N
Bought by
Baukol Philip A and Baukol Pov T
Home Financials for this Owner
Home Financials are based on the most recent Mortgage that was taken out on this home.
Original Mortgage
$155,600
Interest Rate
6.68%
Mortgage Type
New Conventional
Create a Home Valuation Report for This Property
The Home Valuation Report is an in-depth analysis detailing your home's value as well as a comparison with similar homes in the area
Home Values in the Area
Average Home Value in this Area
Purchase History
| Date | Buyer | Sale Price | Title Company |
|---|---|---|---|
| Grantham Jennifer Renee | $285,900 | Trademark Title Services Inc | |
| Baukol Phillip A | -- | None Available | |
| Baukol Philip A | $194,500 | None Available |
Source: Public Records
Mortgage History
| Date | Status | Borrower | Loan Amount |
|---|---|---|---|
| Open | Grantham Jennifer Renee | $251,319 | |
| Previous Owner | Baukol Philip A | $155,600 |
Source: Public Records
Tax History Compared to Growth
Tax History
| Year | Tax Paid | Tax Assessment Tax Assessment Total Assessment is a certain percentage of the fair market value that is determined by local assessors to be the total taxable value of land and additions on the property. | Land | Improvement |
|---|---|---|---|---|
| 2024 | $4,552 | $338,700 | $40,000 | $298,700 |
| 2023 | $3,968 | $322,100 | $40,000 | $282,100 |
| 2022 | $3,478 | $303,500 | $40,000 | $263,500 |
| 2021 | $3,252 | $264,400 | $35,000 | $229,400 |
| 2020 | $3,152 | $248,700 | $30,000 | $218,700 |
| 2019 | $3,020 | $233,400 | $30,000 | $203,400 |
| 2018 | $2,761 | $225,700 | $30,000 | $195,700 |
| 2017 | $2,712 | $210,800 | $24,000 | $186,800 |
| 2016 | $2,466 | $182,800 | $21,700 | $161,100 |
| 2015 | $2,334 | $162,300 | $21,300 | $141,000 |
| 2014 | $2,214 | $164,200 | $21,300 | $142,900 |
| 2012 | -- | $159,400 | $21,206 | $138,194 |
Source: Public Records
Map
Nearby Homes
- 3002 7th Ave NW
- 905 Chalet Dr NW
- 19 Elton Ridge Ct NW
- 411 31st St NW
- 3348 Geselle Ln NW
- 414 31st St NW
- 3037 Venice Ln NW
- 526 Zumbro Dr NW
- 2717 Spyglass Ct NW
- 3012 Crescent Ln NW
- 2509 11th Ave NW
- 4017 11th Ave NW
- 280 Penny Ln NE
- XXX County Road 22
- 2645 Riverside Ln NE
- 366 Elton Hills Dr NW Unit 34
- 366 Elton Hills Dr NW Unit 12
- 3522 18th Ave NW
- 3305 18th Ave NW
- 1407 41st St NW
- 3310 8th Ln NW
- 704 Chalet Dr NW
- 3316 8th Ln NW
- 712 Chalet Dr NW
- 728 33rd St NW
- 720 33rd St NW
- 734 33rd St NW
- 3307 8th Ln NW
- 718 Chalet Dr NW
- 714 33rd St NW
- 802 33rd St NW
- 3315 8th Ln NW
- 3322 8th Ln NW
- 642 Chalet Dr NW
- 802 Chalet Dr NW
- 808 33rd St NW
- 808 Chalet Dr NW
- 627 33rd Street Ln NW
- 821 33rd St NW
- 3328 8th Ln NW