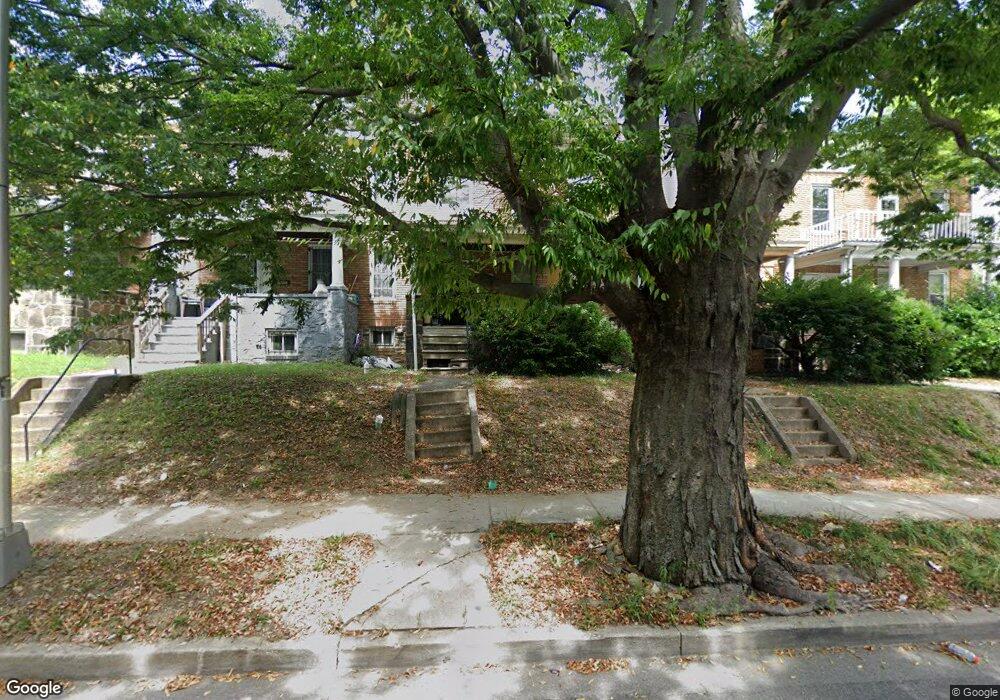
3304 Gwynns Falls Pkwy Baltimore, MD 21216
Walbrook NeighborhoodEstimated Value: $172,314 - $215,000
4
Beds
2
Baths
1,408
Sq Ft
$138/Sq Ft
Est. Value
About This Home
This home is located at 3304 Gwynns Falls Pkwy, Baltimore, MD 21216 and is currently estimated at $193,657, approximately $137 per square foot. 3304 Gwynns Falls Pkwy is a home located in Baltimore City with nearby schools including Hilton Elementary School, Booker T. Washington Middle School, and Frederick Douglass High School.
Ownership History
Date
Name
Owned For
Owner Type
Purchase Details
Closed on
Jun 24, 2022
Sold by
Merlyn Crandon-Enyi
Bought by
Shivers Michael Anthony and Shivers Christine
Current Estimated Value
Home Financials for this Owner
Home Financials are based on the most recent Mortgage that was taken out on this home.
Original Mortgage
$6,725
Outstanding Balance
$6,408
Interest Rate
5.1%
Mortgage Type
New Conventional
Estimated Equity
$187,249
Purchase Details
Closed on
May 9, 2013
Sold by
Crandon Enyi Merlyn and Crandon Merlyn
Bought by
Crandon Enyi Merlyn and Enyi Ikedura
Purchase Details
Closed on
Aug 4, 2005
Sold by
Klausmeyer E Edward
Bought by
Crandon Merlyn
Purchase Details
Closed on
Apr 7, 2005
Sold by
Nesbit James C
Bought by
Klausmeyer E Edward
Create a Home Valuation Report for This Property
The Home Valuation Report is an in-depth analysis detailing your home's value as well as a comparison with similar homes in the area
Home Values in the Area
Average Home Value in this Area
Purchase History
| Date | Buyer | Sale Price | Title Company |
|---|---|---|---|
| Shivers Michael Anthony | $137,000 | Universal Title | |
| Shivers Michael Anthony | $137,000 | Universal Title | |
| Crandon Enyi Merlyn | -- | First American | |
| Crandon Merlyn | $85,000 | -- | |
| Klausmeyer E Edward | $32,000 | -- |
Source: Public Records
Mortgage History
| Date | Status | Borrower | Loan Amount |
|---|---|---|---|
| Open | Shivers Michael Anthony | $6,725 | |
| Closed | Shivers Michael Anthony | $6,725 | |
| Previous Owner | Shivers Michael Anthony | $134,518 |
Source: Public Records
Tax History Compared to Growth
Tax History
| Year | Tax Paid | Tax Assessment Tax Assessment Total Assessment is a certain percentage of the fair market value that is determined by local assessors to be the total taxable value of land and additions on the property. | Land | Improvement |
|---|---|---|---|---|
| 2025 | $2,724 | $126,300 | $25,000 | $101,300 |
| 2024 | $2,724 | $115,967 | $0 | $0 |
| 2023 | $2,493 | $105,633 | $0 | $0 |
| 2022 | $2,249 | $95,300 | $25,000 | $70,300 |
| 2021 | $2,249 | $95,300 | $25,000 | $70,300 |
| 2020 | $2,249 | $95,300 | $25,000 | $70,300 |
| 2019 | $2,368 | $100,800 | $25,000 | $75,800 |
| 2018 | $2,284 | $96,767 | $0 | $0 |
| 2017 | $2,189 | $92,733 | $0 | $0 |
| 2016 | $1,857 | $88,700 | $0 | $0 |
| 2015 | $1,857 | $85,267 | $0 | $0 |
| 2014 | $1,857 | $81,833 | $0 | $0 |
Source: Public Records
Map
Nearby Homes
- 2510 N Ellamont St
- 2307 N Ellamont St
- 3419 Piedmont Ave
- 3210 Windsor Ave
- 3433 Piedmont Ave
- 2403 Garrison Blvd
- 2409 Garrison Blvd
- 3406 Alto Rd
- 2111 N Ellamont St
- 3115 Windsor Ave
- 2100 Denison St
- 3012 Poplar Terrace
- 3001 Elgin Ave
- 3028 Windsor Ave
- 3402 Bateman Ave
- 2200 N Longwood St
- 3000 Windsor Ave
- 2205 Elsinore Ave
- 3015 Windsor Ave
- 3308 Walbrook Ave
- 3306 Gwynns Falls Pkwy
- 3300 Gwynns Falls Pkwy
- 3308 Gwynns Falls Pkwy
- 3310 Gwynns Falls Pkwy
- 3312 Gwynns Falls Pkwy
- 3314 Gwynns Falls Pkwy
- 3228 Gwynns Falls Pkwy
- 3316 Gwynns Falls Pkwy
- 3307 Mondawmin Ave
- 3305 Mondawmin Ave
- 3309 Mondawmin Ave
- 3303 Mondawmin Ave
- 3311 Mondawmin Ave
- 3301 Mondawmin Ave
- 3313 Mondawmin Ave
- 3318 Gwynns Falls Pkwy
- 3226 Gwynns Falls Pkwy
- 3315 Mondawmin Ave
- 3317 Mondawmin Ave
- 3224 Gwynns Falls Pkwy