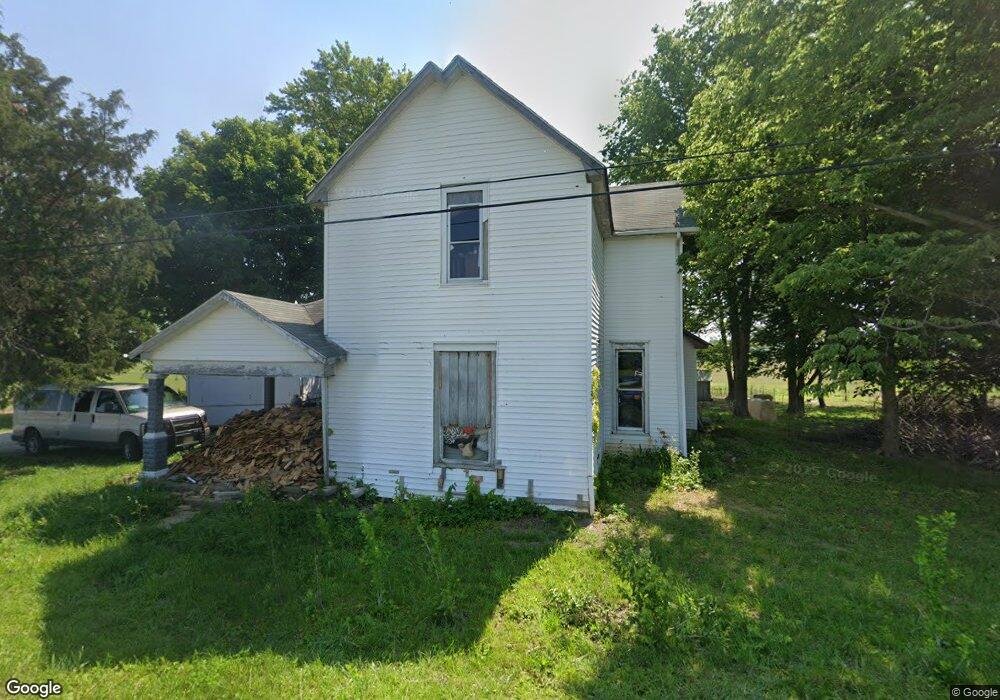
3304 N Wilbur Wright Rd Mooreland, IN 47360
Ashland-Millville NeighborhoodEstimated Value: $118,496 - $272,000
3
Beds
1
Bath
2,206
Sq Ft
$94/Sq Ft
Est. Value
About This Home
This home is located at 3304 N Wilbur Wright Rd, Mooreland, IN 47360 and is currently estimated at $207,624, approximately $94 per square foot. 3304 N Wilbur Wright Rd is a home located in Henry County with nearby schools including Blue River Valley Elementary School and Blue River Valley Junior/Senior High School.
Ownership History
Date
Name
Owned For
Owner Type
Purchase Details
Closed on
Jun 25, 2024
Sold by
Windgate Properties Llc
Bought by
Windgate Properties Llc David
Current Estimated Value
Purchase Details
Closed on
Sep 19, 2018
Sold by
Auditor
Bought by
Windgate Properties Llc
Purchase Details
Closed on
May 16, 2018
Sold by
Newby James E
Bought by
Windgate Properties Llc
Purchase Details
Closed on
May 13, 2011
Sold by
Dishman Jean
Bought by
Newby James E
Purchase Details
Closed on
Dec 28, 2009
Sold by
Boykin Jason and Boykin Stacie
Bought by
Dishman Jean
Purchase Details
Closed on
Aug 18, 2006
Sold by
Dishman Jean
Bought by
Boykin Jason and Boykin Stacie
Home Financials for this Owner
Home Financials are based on the most recent Mortgage that was taken out on this home.
Original Mortgage
$10,000
Interest Rate
6.4%
Mortgage Type
Seller Take Back
Create a Home Valuation Report for This Property
The Home Valuation Report is an in-depth analysis detailing your home's value as well as a comparison with similar homes in the area
Home Values in the Area
Average Home Value in this Area
Purchase History
| Date | Buyer | Sale Price | Title Company |
|---|---|---|---|
| Windgate Properties Llc David | $31,000 | Law Office Of Wayne Greeson Pc | |
| Windgate Properties Llc | $10,000 | -- | |
| Windgate Properties Llc | $10,000 | None Available | |
| Newby James E | -- | None Available | |
| Dishman Jean | -- | None Available | |
| Boykin Jason | $10,000 | None Available |
Source: Public Records
Mortgage History
| Date | Status | Borrower | Loan Amount |
|---|---|---|---|
| Previous Owner | Boykin Jason | $10,000 |
Source: Public Records
Tax History Compared to Growth
Tax History
| Year | Tax Paid | Tax Assessment Tax Assessment Total Assessment is a certain percentage of the fair market value that is determined by local assessors to be the total taxable value of land and additions on the property. | Land | Improvement |
|---|---|---|---|---|
| 2024 | $395 | $74,800 | $12,900 | $61,900 |
| 2023 | $1,248 | $62,300 | $12,900 | $49,400 |
| 2022 | $1,281 | $63,900 | $12,900 | $51,000 |
| 2021 | $1,126 | $56,200 | $12,900 | $43,300 |
| 2020 | $1,285 | $62,300 | $12,900 | $49,400 |
| 2019 | $1,268 | $61,500 | $12,900 | $48,600 |
| 2018 | $1,258 | $61,000 | $12,900 | $48,100 |
| 2017 | $1,288 | $60,500 | $12,900 | $47,600 |
| 2016 | $1,231 | $59,700 | $12,900 | $46,800 |
| 2014 | $1,203 | $60,100 | $12,900 | $47,200 |
| 2013 | $1,203 | $58,000 | $12,900 | $45,100 |
Source: Public Records
Map
Nearby Homes
- 000 E Us Highway 36
- 4797 N County Road 550 E
- 5694 E US Highway 36
- 5694 E State Road 36
- 5398 U S 36
- 176 S Wilbur Wright Rd
- 419 S Wilbur Wright Rd
- 10605 Dalton Rd
- 9095 E State Road 38
- 3215 E Brown Rd
- 3108 Brown St
- 0 Ellen Ct
- Lot 29 Ellen Ct
- LOT 25 Ellen Ct
- 1820 S County Road 850 E
- 5637 N County Road 900 E
- 0 E County Road 150 N Unit 11595995
- 0 E County Road 150 N Unit MBR22059035
- 1294 N Hillsboro Rd
- 8733 N County Road 575 E
- 3277 N Wilbur Wright Rd
- 3337 N Wilbur Wright Rd
- 2984 N Wilbur Wright Rd
- 2963 N Wilbur Wright Rd
- 6782 E County Road 300 N
- 3634 N Wilbur Wright Rd
- 6755 E County Road 300 N
- 3781 N Wilbur Wright Rd
- 3418 N County Road 750 E
- 7650 E County Road 300 N
- 0000 E County Road 300 N
- 3618 N County Road 750 E
- 3576 N County Road 750 E
- 2714 N Wilbur Wright Rd
- 7507 E County Road 300 N
- 6475 E County Road 300 N
- 3924 N Wilbur Wright Rd
- 7670 E County Road 300 N
- 2828 N County Road 750 E
- 4051 N Wilbur Wright Rd