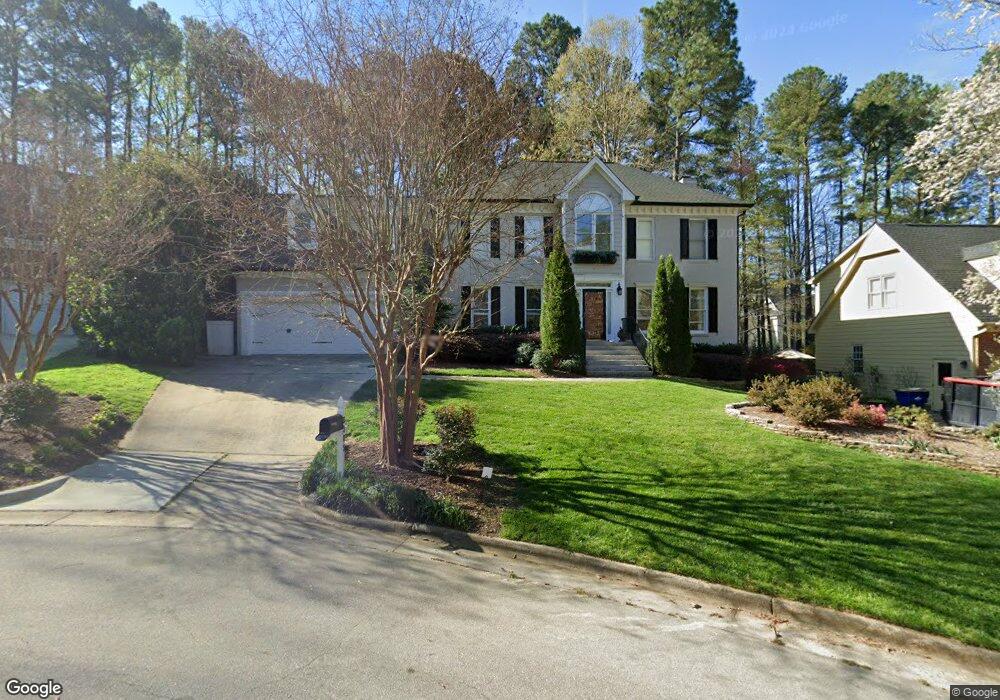
3305 Carrack Ct Raleigh, NC 27613
Stonehenge NeighborhoodEstimated Value: $771,000 - $862,000
4
Beds
4
Baths
3,195
Sq Ft
$253/Sq Ft
Est. Value
About This Home
This home is located at 3305 Carrack Ct, Raleigh, NC 27613 and is currently estimated at $806,985, approximately $252 per square foot. 3305 Carrack Ct is a home located in Wake County with nearby schools including York Elementary School, Leesville Road Middle School, and Leesville Road High School.
Ownership History
Date
Name
Owned For
Owner Type
Purchase Details
Closed on
Sep 9, 2025
Sold by
Riggins Stephanie L and Riggins Deborah M
Bought by
Stephanie And Deborah Riggins Living Trust and Riggins
Current Estimated Value
Purchase Details
Closed on
Jul 3, 2018
Sold by
Davis John A and Davis Georgia Carolym M
Bought by
Riggins Stephanie L and Riggins Deborah M
Home Financials for this Owner
Home Financials are based on the most recent Mortgage that was taken out on this home.
Original Mortgage
$524,000
Interest Rate
4.5%
Mortgage Type
New Conventional
Purchase Details
Closed on
May 27, 2008
Sold by
Goode Richard A and Goode Patricia S
Bought by
Davis John A and Davis Georgia Carolyn M
Home Financials for this Owner
Home Financials are based on the most recent Mortgage that was taken out on this home.
Original Mortgage
$391,000
Interest Rate
6%
Mortgage Type
Purchase Money Mortgage
Purchase Details
Closed on
Mar 20, 2000
Sold by
Berger Jonathan D
Bought by
Goode Richard A and Goode Patricia S
Create a Home Valuation Report for This Property
The Home Valuation Report is an in-depth analysis detailing your home's value as well as a comparison with similar homes in the area
Home Values in the Area
Average Home Value in this Area
Purchase History
| Date | Buyer | Sale Price | Title Company |
|---|---|---|---|
| Stephanie And Deborah Riggins Living Trust | -- | None Listed On Document | |
| Riggins Stephanie L | $528,000 | None Available | |
| Davis John A | $435,000 | None Available | |
| Goode Richard A | $300,000 | -- |
Source: Public Records
Mortgage History
| Date | Status | Borrower | Loan Amount |
|---|---|---|---|
| Previous Owner | Riggins Stephanie L | $524,000 | |
| Previous Owner | Davis John A | $391,000 |
Source: Public Records
Tax History Compared to Growth
Tax History
| Year | Tax Paid | Tax Assessment Tax Assessment Total Assessment is a certain percentage of the fair market value that is determined by local assessors to be the total taxable value of land and additions on the property. | Land | Improvement |
|---|---|---|---|---|
| 2025 | $6,176 | $705,858 | $180,000 | $525,858 |
| 2024 | $6,150 | $705,858 | $180,000 | $525,858 |
| 2023 | $5,605 | $512,368 | $120,000 | $392,368 |
| 2022 | $5,208 | $512,368 | $120,000 | $392,368 |
| 2021 | $5,005 | $512,368 | $120,000 | $392,368 |
| 2020 | $4,914 | $512,368 | $120,000 | $392,368 |
| 2019 | $4,746 | $407,767 | $100,000 | $307,767 |
| 2018 | $0 | $407,767 | $100,000 | $307,767 |
| 2017 | $4,262 | $407,767 | $100,000 | $307,767 |
| 2016 | $4,174 | $407,767 | $100,000 | $307,767 |
| 2015 | $4,208 | $404,415 | $124,000 | $280,415 |
| 2014 | $3,991 | $404,415 | $124,000 | $280,415 |
Source: Public Records
Map
Nearby Homes
- 7628 Valview St
- 7601 Valview St
- 8100 Laurel Mountain Rd
- 7740 Wilderness Rd
- 7401 Ray Rd
- 7741 Wilderness Rd
- 4104 Betterton Dr
- 4103 Landfall Ct
- 2610 Sawmill Rd
- 7417 Fontana Ridge Ln
- 8605 Brookdale Dr
- 2609 Cobworth Ct
- 2704 Smokey Ridge Rd
- 4416 Lancashire Dr
- 8326 Ray Rd
- 8604 Wellsley Way
- 8404 Sleepy Creek Dr
- 8920 Taymouth Ct
- 3812 Covina Dr
- 6901 Saxby Ct
- 3309 Carrack Ct
- 3301 Carrack Ct
- 3308 Clandon Park Dr
- 3304 Clandon Park Dr
- 3313 Carrack Ct
- 3300 Carrack Ct
- 3308 Carrack Ct
- 3304 Carrack Ct
- 3316 Clandon Park Dr
- 3312 Carrack Ct
- 7903 Laurel Mountain Rd
- 7801 Laurel Mountain Rd
- 3317 Carrack Ct
- 3320 Clandon Park Dr
- 7905 Laurel Mountain Rd
- 7908 Sandy Bottom Way
- 7904 Sandy Bottom Way
- 7912 Sandy Bottom Way
- 3316 Carrack Ct
- 7900 Sandy Bottom Way