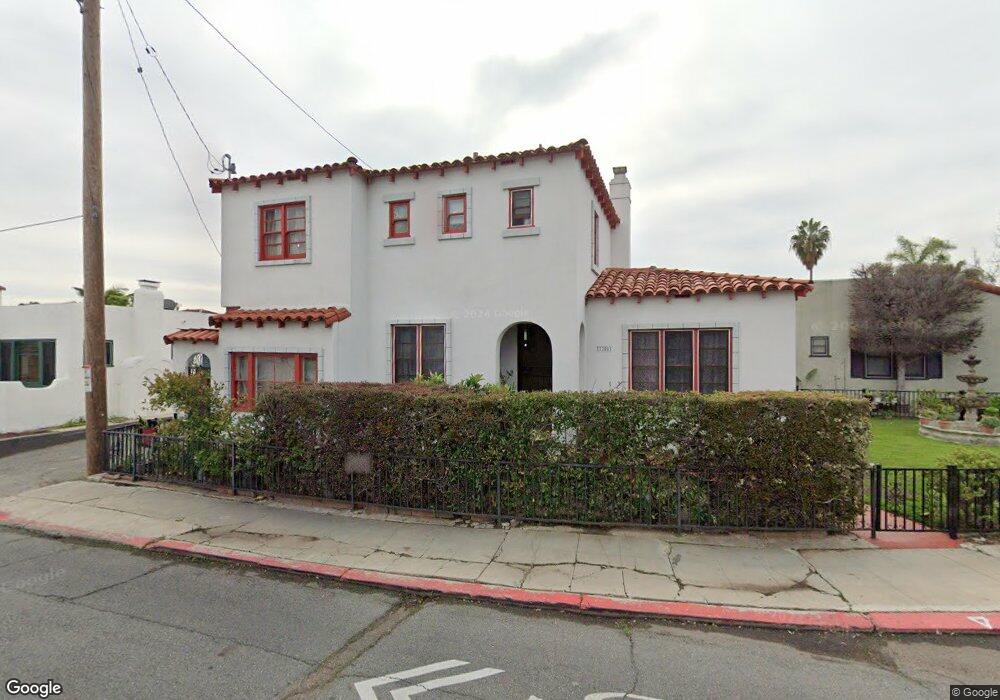
3305 Upas St San Diego, CA 92104
North Park NeighborhoodEstimated Value: $1,028,000 - $1,400,000
3
Beds
1
Bath
1,365
Sq Ft
$890/Sq Ft
Est. Value
About This Home
This home is located at 3305 Upas St, San Diego, CA 92104 and is currently estimated at $1,214,256, approximately $889 per square foot. 3305 Upas St is a home located in San Diego County with nearby schools including McKinley Elementary School, Roosevelt International Middle School, and St. Patrick's School.
Ownership History
Date
Name
Owned For
Owner Type
Purchase Details
Closed on
Apr 16, 2003
Sold by
Salazar Carolin S
Bought by
Salazar Carolin S
Current Estimated Value
Home Financials for this Owner
Home Financials are based on the most recent Mortgage that was taken out on this home.
Original Mortgage
$157,000
Outstanding Balance
$67,892
Interest Rate
5.84%
Estimated Equity
$1,146,364
Purchase Details
Closed on
Feb 22, 2002
Sold by
Dowell Billy
Bought by
Salazar Carolin S
Purchase Details
Closed on
Jul 28, 1994
Sold by
Hickok Charles H and Ross Lisa G
Bought by
Dowell Billy and Salazar Carolin Dowell
Home Financials for this Owner
Home Financials are based on the most recent Mortgage that was taken out on this home.
Original Mortgage
$150,100
Interest Rate
5%
Purchase Details
Closed on
Jul 1, 1986
Purchase Details
Closed on
Apr 6, 1984
Create a Home Valuation Report for This Property
The Home Valuation Report is an in-depth analysis detailing your home's value as well as a comparison with similar homes in the area
Home Values in the Area
Average Home Value in this Area
Purchase History
| Date | Buyer | Sale Price | Title Company |
|---|---|---|---|
| Salazar Carolin S | -- | United Title Company | |
| Salazar Carolin S | -- | -- | |
| Dowell Billy | $158,000 | Fidelity National Title Ins | |
| -- | $118,500 | -- | |
| -- | $98,500 | -- |
Source: Public Records
Mortgage History
| Date | Status | Borrower | Loan Amount |
|---|---|---|---|
| Open | Salazar Carolin S | $157,000 | |
| Previous Owner | Dowell Billy | $150,100 |
Source: Public Records
Tax History Compared to Growth
Tax History
| Year | Tax Paid | Tax Assessment Tax Assessment Total Assessment is a certain percentage of the fair market value that is determined by local assessors to be the total taxable value of land and additions on the property. | Land | Improvement |
|---|---|---|---|---|
| 2025 | $3,176 | $265,361 | $164,390 | $100,971 |
| 2024 | $3,176 | $260,159 | $161,167 | $98,992 |
| 2023 | $3,103 | $255,058 | $158,007 | $97,051 |
| 2022 | $3,018 | $250,058 | $154,909 | $95,149 |
| 2021 | $2,994 | $245,156 | $151,872 | $93,284 |
| 2020 | $2,957 | $242,643 | $150,315 | $92,328 |
| 2019 | $2,903 | $237,886 | $147,368 | $90,518 |
| 2018 | $2,714 | $233,223 | $144,479 | $88,744 |
| 2017 | $80 | $228,651 | $141,647 | $87,004 |
| 2016 | $2,603 | $224,169 | $138,870 | $85,299 |
| 2015 | $2,564 | $220,803 | $136,785 | $84,018 |
| 2014 | $2,523 | $216,479 | $134,106 | $82,373 |
Source: Public Records
Map
Nearby Homes
- 3388 Bancroft St
- 3509-11 32nd St
- 3572 33rd St
- 3322 Nile St
- 0 Boundary St Unit SB25155904
- 3209-13 31st St
- 3365-69 Grim Ave
- 3694 33rd St
- 3410 Grim Ave
- 3515 Vancouver Ave
- 0 35th St
- 3421 Vancouver Ave
- 3167 Landis St
- 3129 Redwood St
- 2929 32nd St
- 3376 30th St
- 3143-47 30th St
- 3780 32nd St
- 3078 Quince St
- 3739 31st St
- 3381 33rd St
- 3317 Upas St
- 3375 33rd St
- 3405 33rd St
- 3316 Upas St
- 3365-71 33rd St
- 3365 33rd St
- 3378 Felton St Unit 80
- 3372-74 Felton St
- 3406 33rd St
- 3409 33rd St Unit 11
- 3372 Felton St
- 3325 Upas St
- 3386 33rd St
- 3361 33rd St Unit 63
- 3370 Felton St
- 3412 33rd St
- 3382 33rd St
- 3322-24 Wightman St
- 3322 Upas St Unit 24