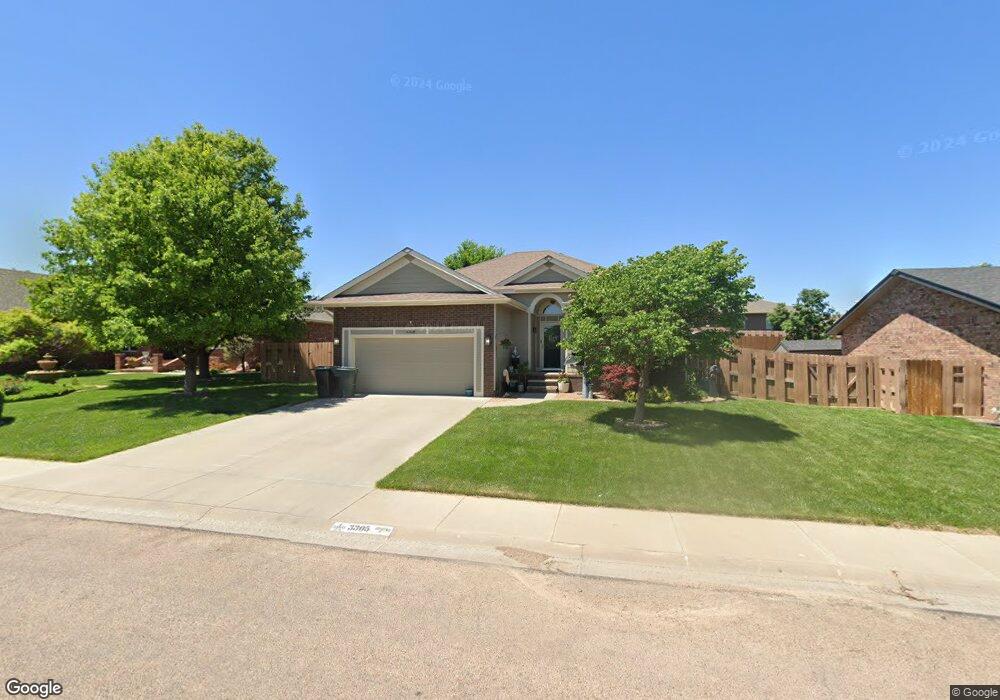
3305 Yellowstar St Garden City, KS 67846
Estimated Value: $310,000 - $336,000
2
Beds
3
Baths
1,386
Sq Ft
$236/Sq Ft
Est. Value
About This Home
This home is located at 3305 Yellowstar St, Garden City, KS 67846 and is currently estimated at $326,826, approximately $235 per square foot. 3305 Yellowstar St is a home located in Finney County with nearby schools including Florence Wilson Elementary School, Kenneth Henderson Middle School, and Bernadine Sitts Intermediate Center.
Ownership History
Date
Name
Owned For
Owner Type
Purchase Details
Closed on
Jun 21, 2019
Sold by
Quintero Razel and Caro Jazmin N
Bought by
Quintero Razel and Quintero Jazmin N
Current Estimated Value
Home Financials for this Owner
Home Financials are based on the most recent Mortgage that was taken out on this home.
Original Mortgage
$24,000
Outstanding Balance
$21,059
Interest Rate
4%
Mortgage Type
Credit Line Revolving
Estimated Equity
$305,767
Purchase Details
Closed on
Apr 14, 2017
Sold by
Guerrero Jose N
Bought by
Quintero Razel and Caro Jazmin N
Home Financials for this Owner
Home Financials are based on the most recent Mortgage that was taken out on this home.
Original Mortgage
$200,000
Outstanding Balance
$165,927
Interest Rate
4.1%
Mortgage Type
New Conventional
Estimated Equity
$160,899
Purchase Details
Closed on
Sep 29, 2016
Sold by
Stratman Dacia L
Bought by
Guerrero Jose N
Create a Home Valuation Report for This Property
The Home Valuation Report is an in-depth analysis detailing your home's value as well as a comparison with similar homes in the area
Home Values in the Area
Average Home Value in this Area
Purchase History
| Date | Buyer | Sale Price | Title Company |
|---|---|---|---|
| Quintero Razel | -- | First American Title | |
| Quintero Razel | -- | Security 1St Title | |
| Guerrero Jose N | -- | None Available |
Source: Public Records
Mortgage History
| Date | Status | Borrower | Loan Amount |
|---|---|---|---|
| Open | Quintero Razel | $24,000 | |
| Open | Quintero Razel | $200,000 |
Source: Public Records
Tax History Compared to Growth
Tax History
| Year | Tax Paid | Tax Assessment Tax Assessment Total Assessment is a certain percentage of the fair market value that is determined by local assessors to be the total taxable value of land and additions on the property. | Land | Improvement |
|---|---|---|---|---|
| 2024 | $5,967 | $36,136 | $3,979 | $32,157 |
| 2023 | $5,967 | $35,642 | $3,979 | $31,663 |
| 2022 | $5,002 | $30,551 | $2,309 | $28,242 |
| 2021 | $4,544 | $27,449 | $2,309 | $25,140 |
| 2020 | $4,135 | $25,438 | $2,309 | $23,129 |
| 2019 | $4,228 | $26,373 | $2,309 | $24,064 |
| 2018 | $4,249 | $26,610 | $2,309 | $24,301 |
| 2017 | $4,196 | $0 | $0 | $0 |
| 2016 | $3,761 | $0 | $0 | $0 |
| 2015 | $3,697 | $0 | $0 | $0 |
| 2012 | -- | $0 | $0 | $0 |
Source: Public Records
Map
Nearby Homes
- 3321 Eagle Dr
- 3208 Primrose St
- 1918 Prairie View Dr
- 1844 Prairie View Dr
- 1842 Prairie View Dr
- 1841 Prairie View Dr
- 1833 Prairie View Dr
- 2808 N Broadmoor Place
- 2065 Cottontail Ct
- 2075 Cottontail Ct
- 2090 Cottontail Ct
- 2055 Cottontail Ct
- 2085 Cottontail Ct
- 2095 Cottontail Ct
- 2060 Cottontail Ct
- 2402 N Koster St
- 2617 N Coachman Ln
- 1810 N Koster St
- 704 E Stone St
- 2504 N Carriage Ln
- 3303 Yellowstar St
- 3312 Eagle St
- 3310 Eagle St
- 3314 Eagle St
- 3309 Yellowstar St
- 3308 Eagle St
- 3308 Yellowstar St
- 3306 Yellowstar St
- 3316 Eagle St
- 3306 Eagle St
- 3310 Yellowstar St
- 3304 Yellowstar St
- 3306 Eagle Dr
- 3318 Eagle St
- 3209 Yellowstar St
- 3304 Eagle St
- 3311 Yellowstar St
- 3302 Yellowstar St
- 3312 Yellowstar St
- 3320 Eagle St