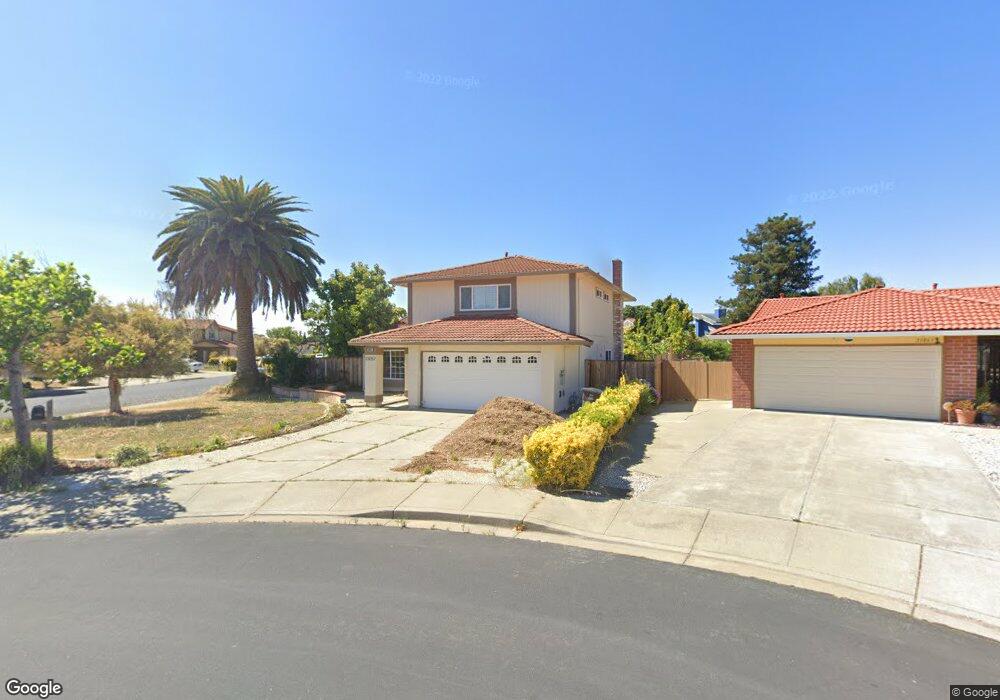
33057 Brockway Ct Union City, CA 94587
Alvarado NeighborhoodEstimated Value: $1,278,000 - $1,727,860
4
Beds
3
Baths
1,871
Sq Ft
$848/Sq Ft
Est. Value
About This Home
This home is located at 33057 Brockway Ct, Union City, CA 94587 and is currently estimated at $1,585,715, approximately $847 per square foot. 33057 Brockway Ct is a home located in Alameda County with nearby schools including Pioneer Elementary School, Itliong-Vera Cruz, and James Logan High School.
Ownership History
Date
Name
Owned For
Owner Type
Purchase Details
Closed on
Dec 18, 2022
Sold by
Yang Qing and Yang Yan
Bought by
Yang And Li Family Trust
Current Estimated Value
Purchase Details
Closed on
Dec 15, 2021
Sold by
Yang Qing and Li Yan
Bought by
Yang Qing and Li Yan
Home Financials for this Owner
Home Financials are based on the most recent Mortgage that was taken out on this home.
Original Mortgage
$714,000
Interest Rate
2.98%
Mortgage Type
New Conventional
Purchase Details
Closed on
Dec 19, 2017
Sold by
Aurorasky Investment Llc
Bought by
Yang Qing and Li Yan
Home Financials for this Owner
Home Financials are based on the most recent Mortgage that was taken out on this home.
Original Mortgage
$768,800
Interest Rate
3.5%
Mortgage Type
Adjustable Rate Mortgage/ARM
Purchase Details
Closed on
Aug 31, 2017
Sold by
Mendoza Abelardo T and Mendoza Diosita S
Bought by
Aurorasky Investment Llc
Purchase Details
Closed on
Nov 7, 2007
Sold by
Mendoza Abelardo T and Mendoza Diosita S
Bought by
Mendoza Abelardo T and Mendoza Diosita S
Create a Home Valuation Report for This Property
The Home Valuation Report is an in-depth analysis detailing your home's value as well as a comparison with similar homes in the area
Home Values in the Area
Average Home Value in this Area
Purchase History
| Date | Buyer | Sale Price | Title Company |
|---|---|---|---|
| Yang And Li Family Trust | -- | -- | |
| Yang Qing | -- | Wfg National Title Ins Co | |
| Yang Qing | $961,000 | Old Republic Title Company | |
| Aurorasky Investment Llc | $835,000 | None Available | |
| Mendoza Abelardo T | -- | None Available |
Source: Public Records
Mortgage History
| Date | Status | Borrower | Loan Amount |
|---|---|---|---|
| Previous Owner | Yang Qing | $714,000 | |
| Previous Owner | Yang Qing | $768,800 |
Source: Public Records
Tax History Compared to Growth
Tax History
| Year | Tax Paid | Tax Assessment Tax Assessment Total Assessment is a certain percentage of the fair market value that is determined by local assessors to be the total taxable value of land and additions on the property. | Land | Improvement |
|---|---|---|---|---|
| 2025 | $14,738 | $1,093,434 | $328,030 | $765,404 |
| 2024 | $14,738 | $1,071,994 | $321,598 | $750,396 |
| 2023 | $14,292 | $1,050,977 | $315,293 | $735,684 |
| 2022 | $14,119 | $1,030,374 | $309,112 | $721,262 |
| 2021 | $13,751 | $1,010,174 | $303,052 | $707,122 |
| 2020 | $13,707 | $999,824 | $299,947 | $699,877 |
| 2019 | $13,624 | $980,220 | $294,066 | $686,154 |
| 2018 | $13,302 | $961,000 | $288,300 | $672,700 |
| 2017 | $4,045 | $225,823 | $42,844 | $182,979 |
| 2016 | $3,945 | $221,396 | $42,004 | $179,392 |
| 2015 | $3,884 | $218,071 | $41,373 | $176,698 |
| 2014 | $3,725 | $213,801 | $40,563 | $173,238 |
Source: Public Records
Map
Nearby Homes
- 33018 Soquel St
- 32945 Regents Blvd
- 33064 Compton Ct
- 34102 Zaner Way
- 4852 Nadine Ct
- 4611 Carmen Way
- 4532 Delores Dr
- 4639 Michelle Ct
- 5301 Shamrock Common
- 34198 Tony Terrace
- 34192 Firenze Terrace
- 5621 Via Lugano
- 4272 Warbler Loop
- 32409 Elizabeth Way
- 4231 Hanford St
- 32451 Regents Blvd
- 4141 Deep Creek Rd Unit 137
- 4512 Macbeth Ave
- 6004 Pisa Terrace Unit 119
- 6003 Milano Terrace Unit 14
- 33063 Brockway Ct
- 33043 Brockway St
- 33037 Brockway St
- 33069 Brockway Ct
- 33042 Brockway St
- 33056 Brockway St
- 33060 Soquel St
- 33066 Soquel St
- 33036 Brockway St
- 33072 Soquel St
- 33054 Soquel St
- 33031 Brockway St
- 33062 Brockway St
- 33075 Brockway Ct
- 33048 Soquel St
- 33078 Soquel St
- 33081 Brockway Ct
- 33087 Brockway Ct
- 33030 Brockway St
- 33042 Soquel St