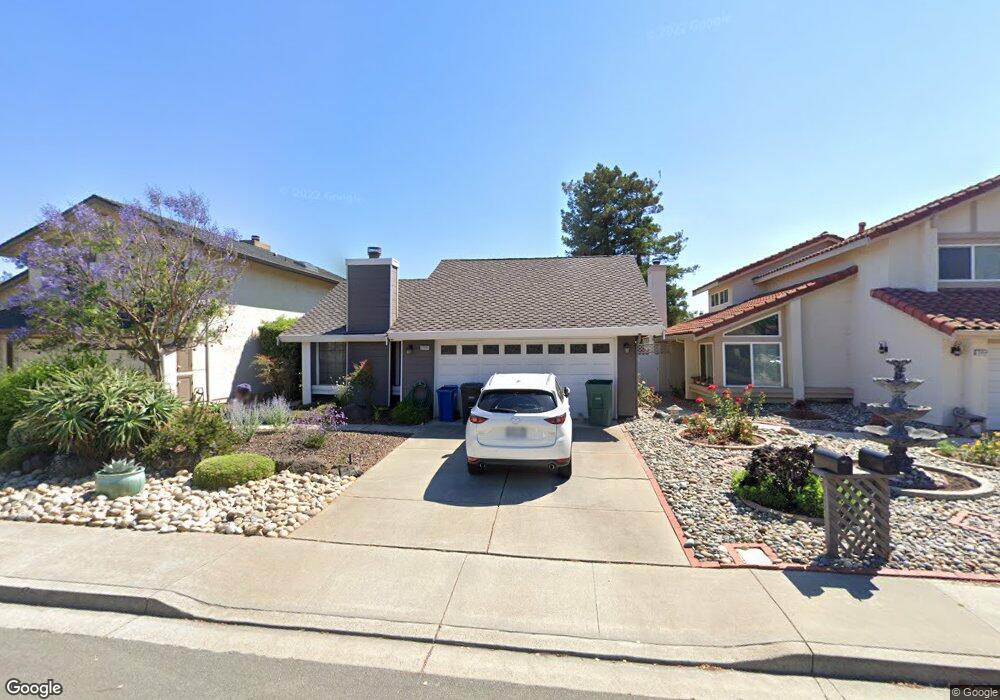
33060 Soquel St Union City, CA 94587
Alvarado NeighborhoodEstimated Value: $1,418,309 - $1,476,000
3
Beds
2
Baths
1,552
Sq Ft
$937/Sq Ft
Est. Value
About This Home
This home is located at 33060 Soquel St, Union City, CA 94587 and is currently estimated at $1,453,827, approximately $936 per square foot. 33060 Soquel St is a home located in Alameda County with nearby schools including Pioneer Elementary School, Itliong-Vera Cruz, and James Logan High School.
Ownership History
Date
Name
Owned For
Owner Type
Purchase Details
Closed on
Jan 4, 2017
Sold by
Kennard Cristina M
Bought by
Moretto Cristina and The Cristina Moretto Trust
Current Estimated Value
Purchase Details
Closed on
Aug 12, 2003
Sold by
Kennard Gary S
Bought by
Kennard Cristina M
Home Financials for this Owner
Home Financials are based on the most recent Mortgage that was taken out on this home.
Original Mortgage
$277,600
Interest Rate
6.14%
Mortgage Type
Purchase Money Mortgage
Purchase Details
Closed on
Dec 13, 1999
Sold by
Lin Chunnan and Kanazawa Takako
Bought by
Kennard Gary S and Kennard Cristina M
Home Financials for this Owner
Home Financials are based on the most recent Mortgage that was taken out on this home.
Original Mortgage
$292,000
Interest Rate
7.75%
Create a Home Valuation Report for This Property
The Home Valuation Report is an in-depth analysis detailing your home's value as well as a comparison with similar homes in the area
Home Values in the Area
Average Home Value in this Area
Purchase History
| Date | Buyer | Sale Price | Title Company |
|---|---|---|---|
| Moretto Cristina | -- | None Available | |
| Kennard Cristina M | -- | Chicago Title Company | |
| Kennard Gary S | $365,000 | Fidelity National Title |
Source: Public Records
Mortgage History
| Date | Status | Borrower | Loan Amount |
|---|---|---|---|
| Previous Owner | Kennard Cristina M | $277,600 | |
| Previous Owner | Kennard Gary S | $292,000 | |
| Closed | Kennard Gary S | $36,500 | |
| Closed | Kennard Cristina M | $20,000 |
Source: Public Records
Tax History Compared to Growth
Tax History
| Year | Tax Paid | Tax Assessment Tax Assessment Total Assessment is a certain percentage of the fair market value that is determined by local assessors to be the total taxable value of land and additions on the property. | Land | Improvement |
|---|---|---|---|---|
| 2025 | $8,348 | $560,964 | $168,289 | $392,675 |
| 2024 | $8,348 | $549,967 | $164,990 | $384,977 |
| 2023 | $8,056 | $539,184 | $161,755 | $377,429 |
| 2022 | $7,933 | $528,614 | $158,584 | $370,030 |
| 2021 | $7,728 | $518,251 | $155,475 | $362,776 |
| 2020 | $7,706 | $512,941 | $153,882 | $359,059 |
| 2019 | $7,657 | $502,885 | $150,865 | $352,020 |
| 2018 | $7,472 | $493,027 | $147,908 | $345,119 |
| 2017 | $7,315 | $483,361 | $145,008 | $338,353 |
| 2016 | $7,150 | $473,886 | $142,166 | $331,720 |
| 2015 | $7,062 | $466,768 | $140,030 | $326,738 |
| 2014 | $6,770 | $457,625 | $137,287 | $320,338 |
Source: Public Records
Map
Nearby Homes
- 33018 Soquel St
- 32945 Regents Blvd
- 33064 Compton Ct
- 34102 Zaner Way
- 4852 Nadine Ct
- 4611 Carmen Way
- 4532 Delores Dr
- 4639 Michelle Ct
- 5301 Shamrock Common
- 34198 Tony Terrace
- 34192 Firenze Terrace
- 5621 Via Lugano
- 4272 Warbler Loop
- 32409 Elizabeth Way
- 4141 Deep Creek Rd Unit 137
- 4231 Hanford St
- 32451 Regents Blvd
- 4512 Macbeth Ave
- 6004 Pisa Terrace Unit 119
- 6003 Milano Terrace Unit 14
- 33066 Soquel St
- 33054 Soquel St
- 33048 Soquel St
- 33072 Soquel St
- 33063 Brockway Ct
- 33043 Brockway St
- 33042 Soquel St
- 4874 Kenwood St
- 33037 Brockway St
- 4873 Mendota St
- 33078 Soquel St
- 33057 Brockway Ct
- 33069 Brockway Ct
- 33036 Soquel St
- 33031 Brockway St
- 4866 Kenwood St
- 4869 Mendota St
- 4882 Mendota St
- 33030 Soquel St
- 4858 Kenwood St