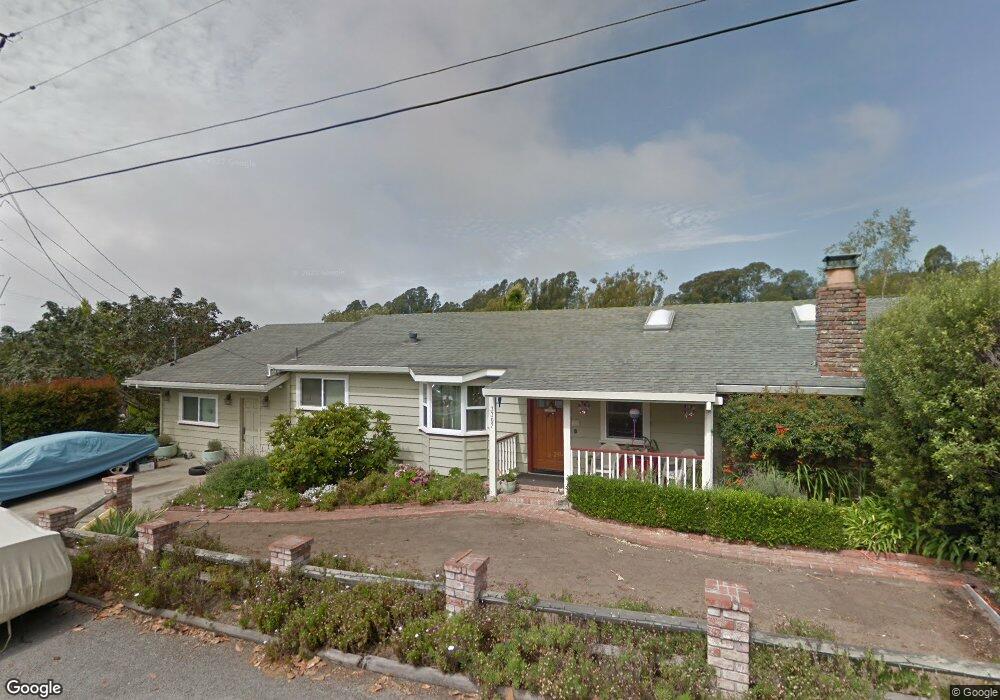
3307 Maplethorpe Ln Soquel, CA 95073
Estimated Value: $1,182,482 - $1,308,000
3
Beds
2
Baths
1,664
Sq Ft
$732/Sq Ft
Est. Value
About This Home
This home is located at 3307 Maplethorpe Ln, Soquel, CA 95073 and is currently estimated at $1,217,871, approximately $731 per square foot. 3307 Maplethorpe Ln is a home located in Santa Cruz County with nearby schools including Main Street Elementary School, New Brighton Middle School, and Mission Hill Middle School.
Ownership History
Date
Name
Owned For
Owner Type
Purchase Details
Closed on
Aug 23, 1994
Sold by
Peterson Raymond P and Peterson Dianna I
Bought by
Scott Kevin Dwight and Scott Jeanette
Current Estimated Value
Home Financials for this Owner
Home Financials are based on the most recent Mortgage that was taken out on this home.
Original Mortgage
$217,750
Interest Rate
5.37%
Create a Home Valuation Report for This Property
The Home Valuation Report is an in-depth analysis detailing your home's value as well as a comparison with similar homes in the area
Home Values in the Area
Average Home Value in this Area
Purchase History
| Date | Buyer | Sale Price | Title Company |
|---|---|---|---|
| Scott Kevin Dwight | $242,000 | Santa Cruz Title Company |
Source: Public Records
Mortgage History
| Date | Status | Borrower | Loan Amount |
|---|---|---|---|
| Previous Owner | Scott Kevin Dwight | $217,750 |
Source: Public Records
Tax History
| Year | Tax Paid | Tax Assessment Tax Assessment Total Assessment is a certain percentage of the fair market value that is determined by local assessors to be the total taxable value of land and additions on the property. | Land | Improvement |
|---|---|---|---|---|
| 2025 | $5,791 | $406,493 | $218,366 | $188,127 |
| 2023 | $5,625 | $390,708 | $209,886 | $180,822 |
| 2022 | $5,520 | $383,048 | $205,771 | $177,277 |
| 2021 | $5,265 | $375,537 | $201,736 | $173,801 |
| 2020 | $5,196 | $371,686 | $199,668 | $172,018 |
| 2019 | $5,076 | $364,398 | $195,752 | $168,646 |
| 2018 | $4,979 | $357,253 | $191,914 | $165,339 |
| 2017 | $4,904 | $350,248 | $188,151 | $162,097 |
| 2016 | $4,666 | $343,381 | $184,462 | $158,919 |
Source: Public Records
Map
Nearby Homes
- 3233 Maplethorpe Ln
- 3321 Ashwood Way Unit 3321
- 115 Darlington Ln
- 109 Darlington Ln
- 103 Darlington Ln
- 6125 Abbey Rd
- 5493 Ball Dr
- 3069 Arlington Dr
- 5606 Soquel Dr
- 2623 Willowbrook Ln Unit 118
- 5425 Jigger Dr
- 6247 Cabot Ct
- 3015 Arlington Dr
- 3006 Atherton Dr
- 2607 Willowbrook Ln Unit 58
- 2607 Willowbrook Ln Unit 54
- 2603 Willowbrook Ln Unit 22
- 27 Pepperwood Way Unit 27
- 17 Pepperwood Way Unit 17
- 230 Rosemarie Ct
- 3309 Maplethorpe Ln
- 3305 Maplethorpe Ln
- 3356 Maplethorpe Ln
- 3311 Maplethorpe Ln
- 3451 Maplethorpe Ln
- 119 Colleen Way
- 3237 Maplethorpe Ln
- 3393 Maplethorpe Ln
- 3313 Maplethorpe Ln
- 120 Colleen Way
- 111 Colleen Way
- 3354 Maplethorpe Ln
- 3350 Maplethorpe Ln
- 3405 Maplethorpe Ln
- 3234 Maplethorpe Ln
- 3352 Maplethorpe Ln
- 3235 Maplethorpe Ln
- 11 Staggi Ct
- 109 Colleen Way
- 3374 Maplethorpe Ln
Your Personal Tour Guide
Ask me questions while you tour the home.