Estimated Value: $581,000 - $661,000
4
Beds
3
Baths
2,631
Sq Ft
$233/Sq Ft
Est. Value
About This Home
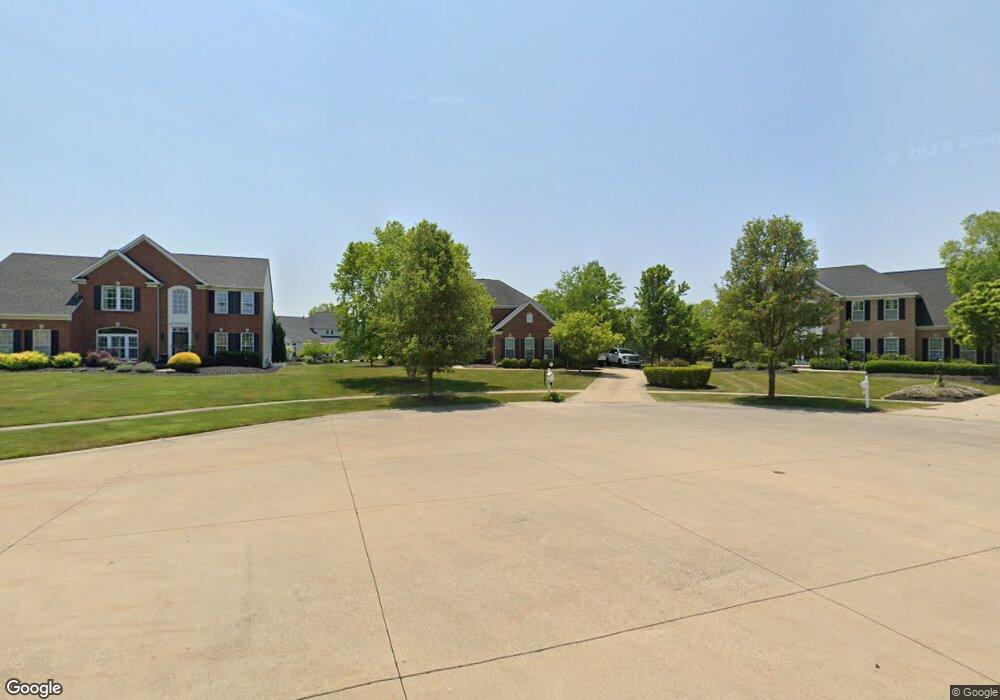
This home is located at 33071 Rhine Cir, Avon, OH 44011 and is currently estimated at $614,242, approximately $233 per square foot. 33071 Rhine Cir is a home located in Lorain County with nearby schools including Avon East Elementary School, Avon Heritage South Elementary School, and Avon Middle School.
Ownership History
Date
Name
Owned For
Owner Type
Purchase Details
Closed on
Jan 31, 2017
Sold by
Frantz Candice
Bought by
Perusek Darren L and Perusek Molly R
Current Estimated Value
Home Financials for this Owner
Home Financials are based on the most recent Mortgage that was taken out on this home.
Original Mortgage
$286,960
Outstanding Balance
$238,253
Interest Rate
4.3%
Mortgage Type
New Conventional
Estimated Equity
$375,989
Purchase Details
Closed on
Sep 16, 2016
Sold by
Ceo Angela M
Bought by
Ceo Angela M and Ceo Trust
Purchase Details
Closed on
Feb 23, 2004
Sold by
Nvr Inc
Bought by
Kovach Christopher S and Ceo Angela M
Home Financials for this Owner
Home Financials are based on the most recent Mortgage that was taken out on this home.
Original Mortgage
$205,000
Interest Rate
5.78%
Mortgage Type
Purchase Money Mortgage
Purchase Details
Closed on
Dec 1, 2003
Sold by
Avon Land Group Ltd
Bought by
Nvr Inc and Ryan Homes
Create a Home Valuation Report for This Property
The Home Valuation Report is an in-depth analysis detailing your home's value as well as a comparison with similar homes in the area
Home Values in the Area
Average Home Value in this Area
Purchase History
| Date | Buyer | Sale Price | Title Company |
|---|---|---|---|
| Perusek Darren L | $358,700 | -- | |
| Ceo Angela M | -- | -- | |
| Kovach Christopher S | $326,200 | Nvr Title Agency Llc | |
| Nvr Inc | $71,800 | U S Title Agency Inc |
Source: Public Records
Mortgage History
| Date | Status | Borrower | Loan Amount |
|---|---|---|---|
| Open | Perusek Darren L | $286,960 | |
| Previous Owner | Kovach Christopher S | $205,000 |
Source: Public Records
Tax History Compared to Growth
Tax History
| Year | Tax Paid | Tax Assessment Tax Assessment Total Assessment is a certain percentage of the fair market value that is determined by local assessors to be the total taxable value of land and additions on the property. | Land | Improvement |
|---|---|---|---|---|
| 2024 | $8,381 | $170,482 | $55,825 | $114,657 |
| 2023 | $7,571 | $136,854 | $48,346 | $88,508 |
| 2022 | $7,500 | $136,854 | $48,346 | $88,508 |
| 2021 | $7,515 | $136,854 | $48,346 | $88,508 |
| 2020 | $7,246 | $123,850 | $43,750 | $80,100 |
| 2019 | $7,098 | $123,850 | $43,750 | $80,100 |
| 2018 | $6,238 | $123,850 | $43,750 | $80,100 |
| 2017 | $5,899 | $103,500 | $24,990 | $78,510 |
| 2016 | $5,968 | $103,500 | $24,990 | $78,510 |
| 2015 | $6,027 | $103,500 | $24,990 | $78,510 |
| 2014 | -- | $91,320 | $22,050 | $69,270 |
| 2013 | $5,302 | $91,320 | $22,050 | $69,270 |
Source: Public Records
Map
Nearby Homes
- 33695 Schwartz Rd
- 33709 Vineyard Park
- BEDFORD Plan at Fieldstone Landings
- CRESTWOOD Plan at Fieldstone Landings
- VIOLA Plan at Fieldstone Landings
- CHAMP Plan at Fieldstone Landings
- SEBASTIAN Plan at Fieldstone Landings
- BRENNAN Plan at Fieldstone Landings
- ASH LAWN Plan at Fieldstone Landings
- Scottsdale Plan at The Reserve at Mass Estates - Estate Series
- Rockport Plan at The Reserve at Mass Estates - Estate Series
- Rivendale Plan at The Reserve at Mass Estates - Estate Series
- Mayfield Plan at The Reserve at Mass Estates - Estate Series
- Kensington Plan at The Reserve at Mass Estates - Estate Series
- Aspen Plan at The Reserve at Mass Estates - Estate Series
- 3402 Mass Dr
- The Mahogony III Plan at Fieldstone Landings
- The Bexley III Plan at Fieldstone Landings
- The Prescott Plan at Fieldstone Landings
- The Baldwin Plan at Fieldstone Landings
- 33061 Rhine Cir
- 33081 Rhine Cir
- 33316 Vintage Cir
- 33308 Vineyard Park
- 33318 Vintage Cir
- 33300 Vineyard Park
- 3360 Napa Blvd
- 33312 Vineyard Park
- 33324 Vintage Cir
- 33080 Rhine Cir
- 33060 Rhine Cir
- 33070 Rhine Cir
- 33250 Vineyard Park
- 33050 Rhine Cir
- 33133 Schwartz Rd
- 33326 Vintage Cir
- 33321 Vintage Cir
- 0 Schwartz Rd
- 33311 Vineyard Park
- 33301 Vineyard Park