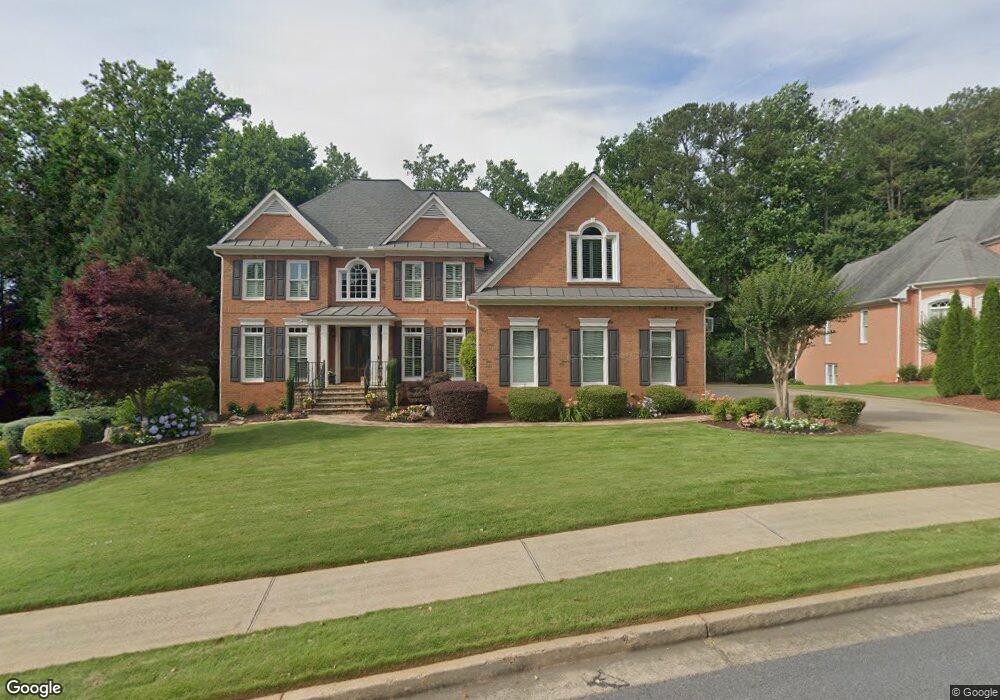
3308 Perrington Pointe Unit 4A Marietta, GA 30066
Sandy Plains NeighborhoodEstimated Value: $1,173,515 - $1,335,000
4
Beds
5
Baths
4,297
Sq Ft
$287/Sq Ft
Est. Value
About This Home
This home is located at 3308 Perrington Pointe Unit 4A, Marietta, GA 30066 and is currently estimated at $1,231,838, approximately $286 per square foot. 3308 Perrington Pointe Unit 4A is a home located in Cobb County with nearby schools including Mountain View Elementary School, Simpson Middle School, and Lassiter High School.
Ownership History
Date
Name
Owned For
Owner Type
Purchase Details
Closed on
Jun 27, 2024
Sold by
Muster Alan R and Muster Marci
Bought by
Alan Raymond Muster Revocable Trust and Muster
Current Estimated Value
Purchase Details
Closed on
Jan 6, 2020
Sold by
Muster Alan R
Bought by
Muster Alan R and Muster Marci
Purchase Details
Closed on
May 2, 2005
Sold by
Megson Anne and Megson Gary
Bought by
Clark Michael F and Clark Kelly
Home Financials for this Owner
Home Financials are based on the most recent Mortgage that was taken out on this home.
Original Mortgage
$359,650
Interest Rate
5.99%
Mortgage Type
New Conventional
Purchase Details
Closed on
Oct 2, 1998
Sold by
Neighborhoods John Wieland Hms
Bought by
Megson Gary and Megson Anne R
Home Financials for this Owner
Home Financials are based on the most recent Mortgage that was taken out on this home.
Original Mortgage
$322,600
Interest Rate
6.58%
Mortgage Type
New Conventional
Create a Home Valuation Report for This Property
The Home Valuation Report is an in-depth analysis detailing your home's value as well as a comparison with similar homes in the area
Home Values in the Area
Average Home Value in this Area
Purchase History
| Date | Buyer | Sale Price | Title Company |
|---|---|---|---|
| Alan Raymond Muster Revocable Trust | -- | None Listed On Document | |
| Muster Alan R | -- | -- | |
| Clark Michael F | $605,000 | -- | |
| Megson Gary | $403,300 | -- |
Source: Public Records
Mortgage History
| Date | Status | Borrower | Loan Amount |
|---|---|---|---|
| Previous Owner | Clark Michael F | $359,650 | |
| Previous Owner | Megson Gary | $322,600 |
Source: Public Records
Tax History
| Year | Tax Paid | Tax Assessment Tax Assessment Total Assessment is a certain percentage of the fair market value that is determined by local assessors to be the total taxable value of land and additions on the property. | Land | Improvement |
|---|---|---|---|---|
| 2025 | $10,313 | $417,888 | $80,000 | $337,888 |
| 2024 | $10,322 | $417,888 | $80,000 | $337,888 |
| 2023 | $9,520 | $405,956 | $70,000 | $335,956 |
Source: Public Records
Map
Nearby Homes
- 3490 Talimore Knoll
- 2477 Bobbie Dr
- 3283 Holly Springs Rd NE
- 2415 Wistful Way
- 3676 Edenbourgh Place
- 2867 Holly Oaks Dr
- 3262 Ashmore Hall Dr
- 2864 Holly Oaks Dr
- 2660 Pete Shaw Rd
- 3054 Whisper Knob Rd
- 3873 Manhassett Place NE Unit 2
- 3310 Rangers Gate
- 3851 Trickum Rd NE
- 3150 Trickum Rd NE Unit LOT 1
- 3150 Trickum Rd NE
- 3071 Intrepid Wake
- 3303 Keenland Rd
- 3195 Trickum Rd NE
- 2684 S Arbor Dr
- 2699 S Arbor Dr Unit 2
- 3310 Perrington Pointe
- 3306 Perrington Pointe Unit A4
- 3413 Bonaire Crossing
- 3415 Bonaire Crossing Unit C3
- 3312 Perrington Pointe
- 3307 Perrington Pointe
- 3309 Perrington Pointe
- 3411 Bonaire Crossing
- 3304 Perrington Pointe
- 3409 Bonaire Crossing
- 3417 Bonaire Crossing
- 3311 Perrington Pointe
- 3305 Perrington Pointe
- 3407 Bonaire Crossing
- 3314 Perrington Pointe
- 3400 Woodshire Crossing
- 2914 Perrington Way Unit A4
- 3405 Bonaire Crossing
- 3314 Cranmore Chase
- 3302 Perrington Pointe
Your Personal Tour Guide
Ask me questions while you tour the home.