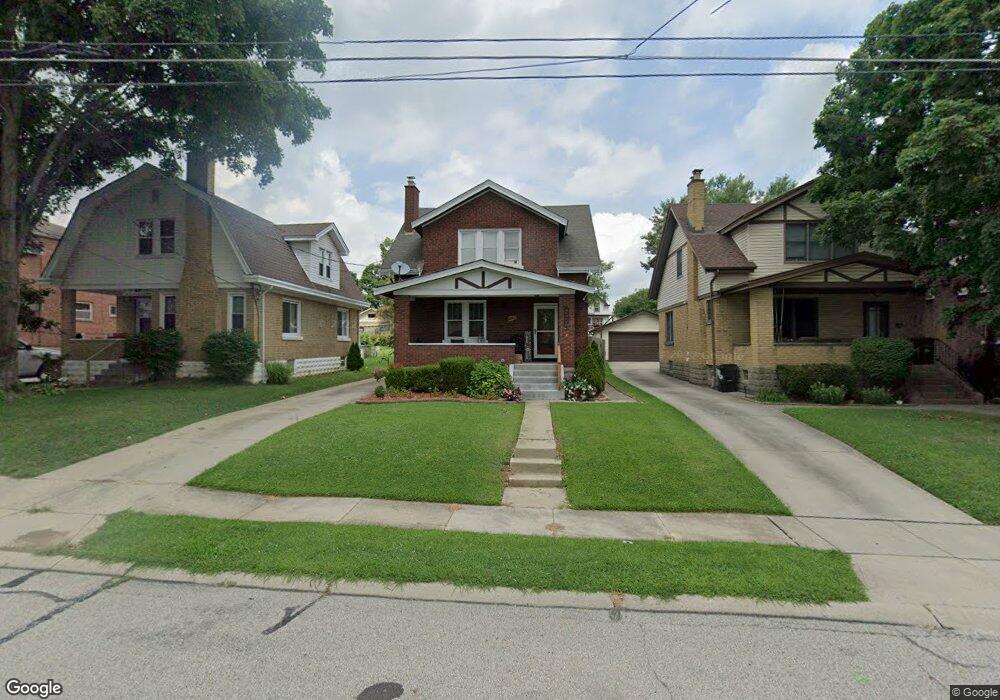
3308 Phoenix Ave Cincinnati, OH 45211
Estimated Value: $198,000 - $225,000
3
Beds
2
Baths
1,395
Sq Ft
$150/Sq Ft
Est. Value
About This Home
This home is located at 3308 Phoenix Ave, Cincinnati, OH 45211 and is currently estimated at $209,152, approximately $149 per square foot. 3308 Phoenix Ave is a home located in Hamilton County with nearby schools including Cheviot Elementary School, Western Hills High School, and Gilbert A. Dater High School.
Ownership History
Date
Name
Owned For
Owner Type
Purchase Details
Closed on
Sep 9, 2022
Sold by
Willoughby Brandon D
Bought by
Willoughby Brandon D and Willoughby Joshua L
Current Estimated Value
Purchase Details
Closed on
Jul 2, 2009
Sold by
Kelly Patrick A and Kelly Julie A
Bought by
Willoughby Brandon D
Home Financials for this Owner
Home Financials are based on the most recent Mortgage that was taken out on this home.
Original Mortgage
$118,808
Interest Rate
5.32%
Mortgage Type
FHA
Purchase Details
Closed on
Jul 24, 1998
Sold by
Schaller Donald E and Schaller Gail L
Bought by
Kelly Patrick A and Kelly Julie A
Home Financials for this Owner
Home Financials are based on the most recent Mortgage that was taken out on this home.
Original Mortgage
$85,900
Interest Rate
7.05%
Create a Home Valuation Report for This Property
The Home Valuation Report is an in-depth analysis detailing your home's value as well as a comparison with similar homes in the area
Home Values in the Area
Average Home Value in this Area
Purchase History
| Date | Buyer | Sale Price | Title Company |
|---|---|---|---|
| Willoughby Brandon D | -- | -- | |
| Willoughby Brandon D | $121,000 | Attorney | |
| Kelly Patrick A | $95,900 | -- |
Source: Public Records
Mortgage History
| Date | Status | Borrower | Loan Amount |
|---|---|---|---|
| Previous Owner | Willoughby Brandon D | $118,808 | |
| Previous Owner | Kelly Patrick A | $85,900 |
Source: Public Records
Tax History
| Year | Tax Paid | Tax Assessment Tax Assessment Total Assessment is a certain percentage of the fair market value that is determined by local assessors to be the total taxable value of land and additions on the property. | Land | Improvement |
|---|---|---|---|---|
| 2025 | $3,184 | $50,985 | $6,909 | $44,076 |
| 2024 | $3,100 | $50,985 | $6,909 | $44,076 |
| 2023 | $3,160 | $50,985 | $6,909 | $44,076 |
| 2022 | $2,551 | $35,648 | $5,982 | $29,666 |
| 2021 | $2,487 | $35,648 | $5,982 | $29,666 |
| 2020 | $2,522 | $35,648 | $5,982 | $29,666 |
| 2019 | $2,482 | $31,546 | $5,292 | $26,254 |
| 2018 | $2,485 | $31,546 | $5,292 | $26,254 |
| 2017 | $2,377 | $31,546 | $5,292 | $26,254 |
| 2016 | $3,361 | $43,621 | $5,450 | $38,171 |
| 2015 | $3,051 | $43,621 | $5,450 | $38,171 |
| 2014 | $2,981 | $43,621 | $5,450 | $38,171 |
| 2013 | $2,936 | $42,350 | $5,292 | $37,058 |
Source: Public Records
Map
Nearby Homes
- 3309 Phoenix Ave
- 3311 Augusta Ave
- 3325 Camvic Terrace
- 3869 Meyerfeld Ave
- 3850 Taft Ave
- 3927 Davis Ave
- 3831 Meyerfeld Ave
- 3594 Homelawn Ave
- 3118 Westwood Northern Blvd
- 4175 Boudinot Ave
- 4117 N Bend Rd
- 3743 Bank Ct
- 3613 Everett Ave
- 4104 Trevor Ave
- 3935 Lovell Ave
- 3236 Van Zandt Dr
- 3143 Mozart Ave
- 4105 Trevor Ave
- 3727 Lovell Ave
- 3498 Boudinot Ave
- 3310 Phoenix Ave
- 3306 Phoenix Ave
- 3304 Phoenix Ave
- 3312 Phoenix Ave Unit 2
- 3312 Phoenix Ave
- 3302 Phoenix Ave
- 3331 Augusta Ave
- 3329 Augusta Ave
- 3300 Phoenix Ave
- 3942 N Bend Rd
- 3333 Augusta Ave
- 3327 Augusta Ave
- 3934 N Bend Rd
- 3944 N Bend Rd
- 3325 Augusta Ave
- 3311 Phoenix Ave
- 3948 N Bend Rd
- 3305 Phoenix Ave
- 3323 Augusta Ave
- 3335 Augusta Ave
Your Personal Tour Guide
Ask me questions while you tour the home.