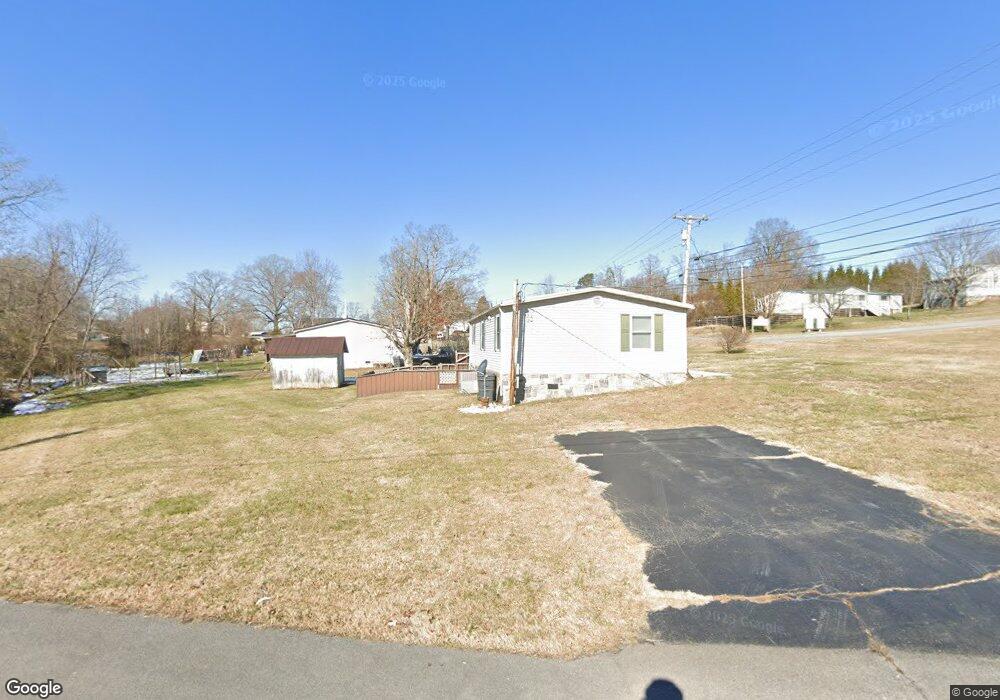
3308 Poplar St White Pine, TN 37890
Estimated Value: $177,838 - $272,000
3
Beds
2
Baths
1,560
Sq Ft
$138/Sq Ft
Est. Value
About This Home
This home is located at 3308 Poplar St, White Pine, TN 37890 and is currently estimated at $215,960, approximately $138 per square foot. 3308 Poplar St is a home located in Jefferson County with nearby schools including Cornerstone Christian Academy.
Ownership History
Date
Name
Owned For
Owner Type
Purchase Details
Closed on
Nov 8, 2017
Sold by
Garrett Savanna M and Tharp Savanna M
Bought by
Garrett Jesse R
Current Estimated Value
Purchase Details
Closed on
Jul 31, 2015
Sold by
Howard Kenneth A
Bought by
Tharp Savanna M and Garrett Jesse R
Home Financials for this Owner
Home Financials are based on the most recent Mortgage that was taken out on this home.
Original Mortgage
$72,168
Outstanding Balance
$56,914
Interest Rate
4.11%
Mortgage Type
FHA
Estimated Equity
$159,046
Purchase Details
Closed on
Dec 5, 2014
Sold by
Secretary Of Housing And Urban
Bought by
Howard Kenneth A
Purchase Details
Closed on
Sep 6, 2013
Sold by
Bank Of America
Bought by
Secretary Of Hud % Michaelson Connor & Boul
Purchase Details
Closed on
Jan 24, 2013
Sold by
Swatsell Wanda Joyce
Bought by
Secretary Of Hud %Michaelson Connor & Boul
Purchase Details
Closed on
May 4, 2007
Bought by
Swatsell Wanda Joyce
Create a Home Valuation Report for This Property
The Home Valuation Report is an in-depth analysis detailing your home's value as well as a comparison with similar homes in the area
Home Values in the Area
Average Home Value in this Area
Purchase History
| Date | Buyer | Sale Price | Title Company |
|---|---|---|---|
| Garrett Jesse R | -- | None Available | |
| Tharp Savanna M | $73,500 | -- | |
| Howard Kenneth A | $27,000 | -- | |
| Secretary Of Hud % Michaelson Connor & Boul | -- | -- | |
| Secretary Of The Dept Of Housi | $144,848 | -- | |
| Secretary Of Hud %Michaelson Connor & Boul | $144,800 | -- | |
| Bank Of America Na | $144,848 | -- | |
| Swatsell Wanda Joyce | $18,000 | -- |
Source: Public Records
Mortgage History
| Date | Status | Borrower | Loan Amount |
|---|---|---|---|
| Open | Tharp Savanna M | $72,168 |
Source: Public Records
Tax History Compared to Growth
Tax History
| Year | Tax Paid | Tax Assessment Tax Assessment Total Assessment is a certain percentage of the fair market value that is determined by local assessors to be the total taxable value of land and additions on the property. | Land | Improvement |
|---|---|---|---|---|
| 2025 | $789 | $52,500 | $6,000 | $46,500 |
| 2023 | $789 | $22,875 | $0 | $0 |
| 2022 | $747 | $22,875 | $5,750 | $17,125 |
| 2021 | $747 | $22,875 | $5,750 | $17,125 |
| 2020 | $747 | $22,875 | $5,750 | $17,125 |
| 2019 | $747 | $22,875 | $5,750 | $17,125 |
| 2018 | $691 | $19,375 | $4,500 | $14,875 |
| 2017 | $691 | $19,375 | $4,500 | $14,875 |
| 2016 | $688 | $19,375 | $4,500 | $14,875 |
| 2015 | $684 | $19,375 | $4,500 | $14,875 |
| 2014 | $682 | $19,375 | $4,500 | $14,875 |
Source: Public Records
Map
Nearby Homes
- 2173 Walnut St
- 2179 Walnut St
- 2167 Walnut St
- 1025 Nease Dr
- 3207 Dove Ln
- 1006 Rachel Dr
- 949 U S 25e
- 3357 Sheila Cir
- 3111 Cecelia St
- 210 Songbird Way
- 216 Songbird Way
- 215 Songbird Way
- 1100 Barker Dr
- 3451 Baker Springs Rd
- 1462 Main St
- 1954 Main St
- 1015 Pratt Dr
- 1605 College St
- 1506 Moyers St
- 3569 Leadvale Rd
- 3308 Poplar St
- 0 Walnut Street Mill St Unit 254122
- 0 Walnut Street Mill Street (Commerical) Unit Walnut Street
- 2279 Walnut St
- 2268 Walnut St
- 2272 Walnut St
- 2267 Walnut St
- 2264 Walnut St
- 2305 Walnut St
- 2305 Walnut St
- 3312 Poplar St
- 103 Howard Dr
- 2260 Walnut St
- 1800 Rosella Dr
- 1096 Rosella Dr
- 109 Howard Dr
- 3302 Texas Ln
- 1092 Rosella Dr
- 2256 Walnut St
- 1106 Rosella Dr