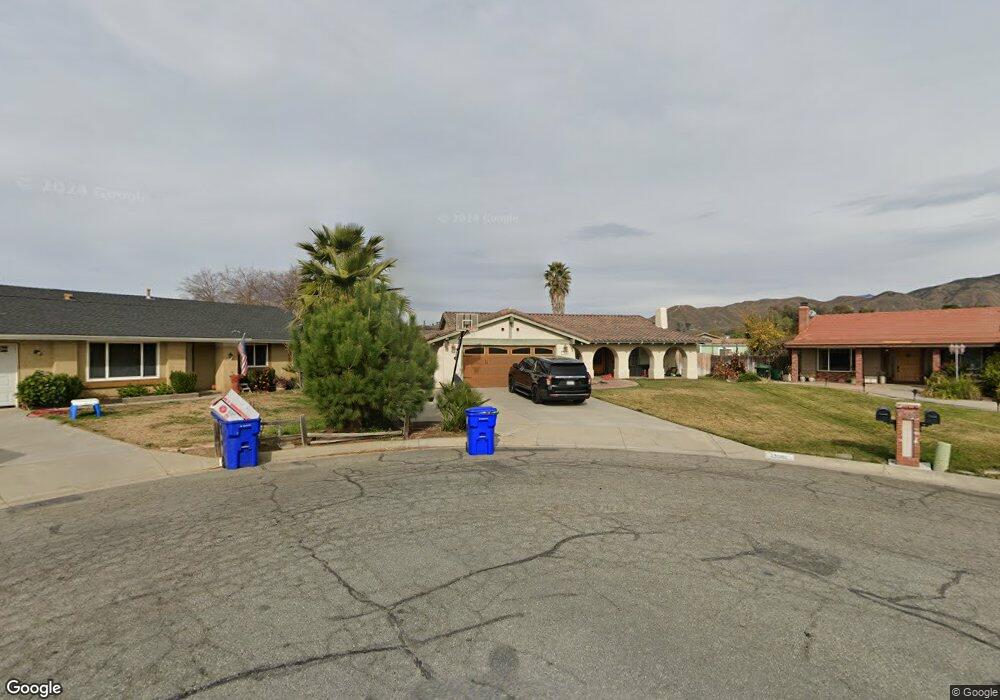
33086 Windsor Ct Yucaipa, CA 92399
Estimated Value: $642,000 - $737,000
4
Beds
2
Baths
1,776
Sq Ft
$388/Sq Ft
Est. Value
About This Home
This home is located at 33086 Windsor Ct, Yucaipa, CA 92399 and is currently estimated at $689,068, approximately $387 per square foot. 33086 Windsor Ct is a home located in San Bernardino County with nearby schools including Dunlap Elementary, Park View Middle School, and Yucaipa High School.
Ownership History
Date
Name
Owned For
Owner Type
Purchase Details
Closed on
Feb 10, 2017
Sold by
Shipwey Bernt
Bought by
Shipley Ryan and Shipley Brent D
Current Estimated Value
Purchase Details
Closed on
Jun 1, 2016
Sold by
Cotarelo Richard W
Bought by
Shipley Brent D
Home Financials for this Owner
Home Financials are based on the most recent Mortgage that was taken out on this home.
Original Mortgage
$312,000
Outstanding Balance
$248,398
Interest Rate
3.58%
Mortgage Type
New Conventional
Estimated Equity
$440,670
Purchase Details
Closed on
Jun 29, 1995
Sold by
Gutierrez Joe
Bought by
Cotarelo Richard W and Cotarelo Brenda
Home Financials for this Owner
Home Financials are based on the most recent Mortgage that was taken out on this home.
Original Mortgage
$148,569
Interest Rate
7.59%
Mortgage Type
FHA
Create a Home Valuation Report for This Property
The Home Valuation Report is an in-depth analysis detailing your home's value as well as a comparison with similar homes in the area
Home Values in the Area
Average Home Value in this Area
Purchase History
| Date | Buyer | Sale Price | Title Company |
|---|---|---|---|
| Shipley Ryan | -- | None Available | |
| Shipley Brent D | $390,000 | First American Title Company | |
| Cotarelo Richard W | $152,000 | First American Title Co |
Source: Public Records
Mortgage History
| Date | Status | Borrower | Loan Amount |
|---|---|---|---|
| Open | Shipley Brent D | $312,000 | |
| Previous Owner | Cotarelo Richard W | $148,569 |
Source: Public Records
Tax History
| Year | Tax Paid | Tax Assessment Tax Assessment Total Assessment is a certain percentage of the fair market value that is determined by local assessors to be the total taxable value of land and additions on the property. | Land | Improvement |
|---|---|---|---|---|
| 2025 | $5,944 | $462,958 | $138,887 | $324,071 |
| 2024 | $5,771 | $453,881 | $136,164 | $317,717 |
| 2023 | $5,658 | $444,981 | $133,494 | $311,487 |
| 2022 | $5,576 | $436,255 | $130,876 | $305,379 |
| 2021 | $5,489 | $427,701 | $128,310 | $299,391 |
| 2020 | $5,528 | $423,315 | $126,994 | $296,321 |
| 2019 | $5,365 | $415,015 | $124,504 | $290,511 |
| 2018 | $4,913 | $405,756 | $121,727 | $284,029 |
| 2017 | $4,792 | $397,800 | $119,340 | $278,460 |
| 2016 | $2,528 | $213,310 | $53,327 | $159,983 |
| 2015 | $2,501 | $210,106 | $52,526 | $157,580 |
| 2014 | $2,449 | $205,990 | $51,497 | $154,493 |
Source: Public Records
Map
Nearby Homes
- 33155 Avenue D
- 33241 Avenue D
- 32797 Avenue D
- 33467 Washington Dr
- 33345 Wallace Way
- 11967 Southwind Way
- 32533 Avenue E
- 12915 14th St
- 92399 Yucaipa Blvd
- 33675 Northview Dr
- 33379 Wallace Way
- 12730 8th St
- 0 Calimesa Blvd Unit IG25119291
- 32390 Avenue D
- 32276 Kentucky St
- 12591 7th St
- 32237 Yucaipa Blvd
- 33817 Liberty Rd
- 33969 Avenue E
- 36551 Avenue E
- 33092 Windsor Ct
- 33084 Windsor Ct
- 12446 Windsor Dr
- 33087 Windsor Ct
- 33093 Windsor Ct
- 12392 Cambria Dr
- 12479 Windsor Dr
- 12398 Cambria Dr
- 12390 Cambria Dr
- 12467 Windsor Dr
- 12457 Windsor Dr
- 12376 Cambria Dr
- 12449 Windsor Dr
- 12366 Cambria Dr
- 12391 Cambria Dr
- 12439 Windsor Dr
- 12434 Windsor Dr
- 12379 Cambria Dr
- 32983 Avenue E
- 12431 Windsor Dr
Your Personal Tour Guide
Ask me questions while you tour the home.