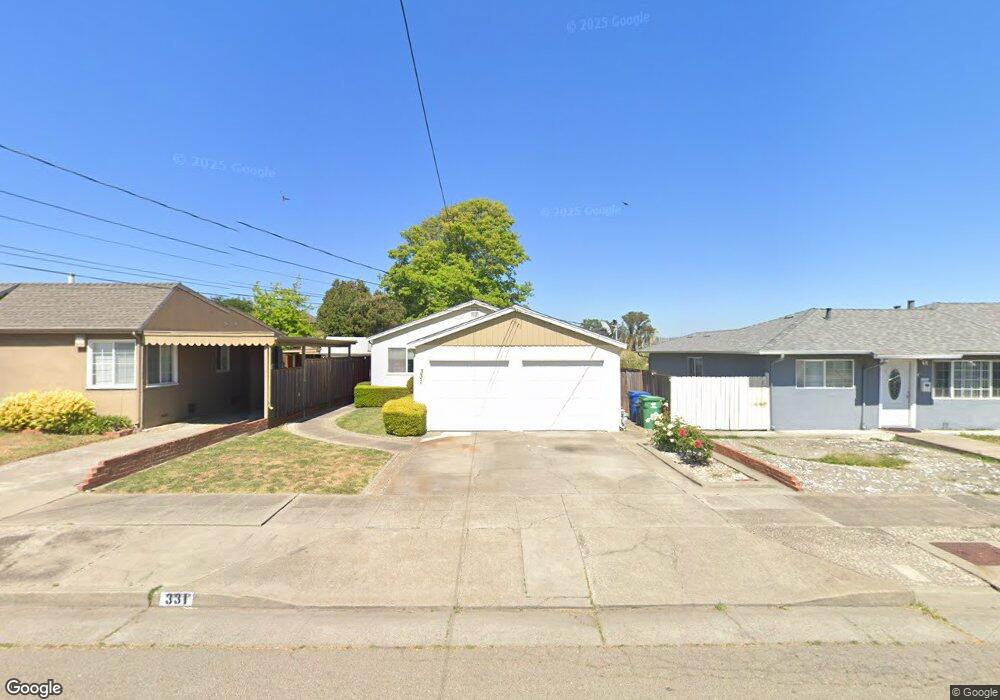
331 Beach Rd Alameda, CA 94502
Estimated Value: $989,000 - $1,219,984
4
Beds
2
Baths
1,560
Sq Ft
$709/Sq Ft
Est. Value
About This Home
This home is located at 331 Beach Rd, Alameda, CA 94502 and is currently estimated at $1,105,996, approximately $708 per square foot. 331 Beach Rd is a home located in Alameda County with nearby schools including Amelia Earhart Elementary School, Lincoln Middle School, and Alameda High School.
Ownership History
Date
Name
Owned For
Owner Type
Purchase Details
Closed on
Dec 19, 2019
Sold by
Ng Tony
Bought by
Ng Tony and Cochrane Louise Fiona
Current Estimated Value
Home Financials for this Owner
Home Financials are based on the most recent Mortgage that was taken out on this home.
Original Mortgage
$408,000
Outstanding Balance
$360,414
Interest Rate
3.7%
Mortgage Type
New Conventional
Estimated Equity
$745,582
Purchase Details
Closed on
Feb 27, 2018
Sold by
Vdh Properties Llc
Bought by
Ng Norman and Ng Tony
Home Financials for this Owner
Home Financials are based on the most recent Mortgage that was taken out on this home.
Original Mortgage
$656,250
Outstanding Balance
$559,256
Interest Rate
4.15%
Mortgage Type
New Conventional
Estimated Equity
$546,740
Purchase Details
Closed on
Dec 27, 2011
Sold by
Mitry Jean A and Vanderhaeghen Steven N
Bought by
Vdh Properties Llc
Create a Home Valuation Report for This Property
The Home Valuation Report is an in-depth analysis detailing your home's value as well as a comparison with similar homes in the area
Purchase History
| Date | Buyer | Sale Price | Title Company |
|---|---|---|---|
| Ng Tony | -- | Accommodation | |
| Ng Tony | -- | Bnt Title Company Of Ca | |
| Ng Norman | $875,000 | Chicago Title Company | |
| Vdh Properties Llc | -- | None Available | |
| Mitry Jean A | -- | None Available |
Source: Public Records
Mortgage History
| Date | Status | Borrower | Loan Amount |
|---|---|---|---|
| Open | Ng Tony | $408,000 | |
| Open | Ng Norman | $656,250 |
Source: Public Records
Tax History
| Year | Tax Paid | Tax Assessment Tax Assessment Total Assessment is a certain percentage of the fair market value that is determined by local assessors to be the total taxable value of land and additions on the property. | Land | Improvement |
|---|---|---|---|---|
| 2025 | $14,289 | $995,583 | $298,675 | $696,908 |
| 2024 | $14,289 | $976,061 | $292,818 | $683,243 |
| 2023 | $13,734 | $956,925 | $287,077 | $669,848 |
| 2022 | $13,420 | $938,165 | $281,449 | $656,716 |
| 2021 | $13,082 | $919,773 | $275,932 | $643,841 |
| 2020 | $12,917 | $910,350 | $273,105 | $637,245 |
| 2019 | $12,376 | $892,500 | $267,750 | $624,750 |
| 2018 | $2,521 | $59,688 | $23,918 | $35,770 |
| 2017 | $2,462 | $58,517 | $23,449 | $35,068 |
| 2016 | $2,431 | $57,370 | $22,989 | $34,381 |
| 2015 | $2,410 | $56,508 | $22,644 | $33,864 |
| 2014 | $2,447 | $55,401 | $22,200 | $33,201 |
Source: Public Records
Map
Nearby Homes
- 3523 Oleander Ave
- 1152 Old Alameda Point
- 1286 Clarke Ln
- 3218 Fir Ave
- 1152 Admiralty Ln
- 1119 Camino Del Valle
- 1160 Marianas Ln
- 179 Oyster Pond Rd
- 3037 Linda Vista
- 30 Sea Bridge
- 3032 Linda Vista
- 154 Basinside Way
- 632 Centre Ct Unit 48
- 641 Centre Ct
- 1037 Via Bonita
- 608 Centre Ct
- 405 Centre Ct
- 267 Ennismore Ct
- 35 Leonard Ct
- 28 Sunny Cove Cir
Your Personal Tour Guide
Ask me questions while you tour the home.