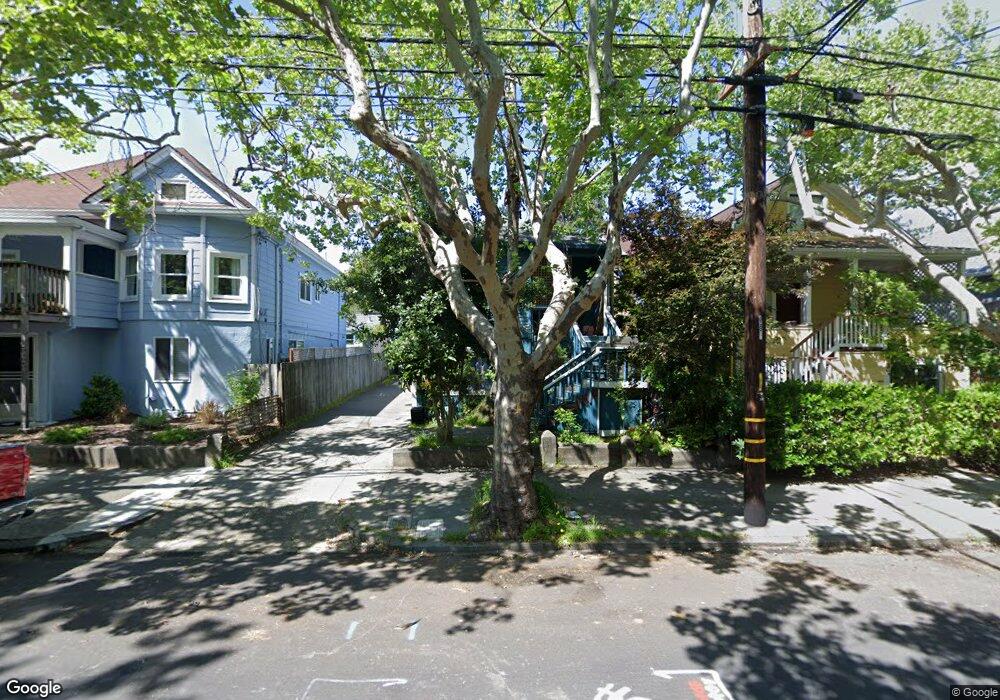
331 C St San Rafael, CA 94901
Gerstle Park NeighborhoodEstimated Value: $927,279 - $1,040,000
4
Beds
2
Baths
1,297
Sq Ft
$745/Sq Ft
Est. Value
About This Home
This home is located at 331 C St, San Rafael, CA 94901 and is currently estimated at $966,820, approximately $745 per square foot. 331 C St is a home located in Marin County with nearby schools including Laurel Dell Elementary School, James B. Davidson Middle School, and San Rafael High School.
Ownership History
Date
Name
Owned For
Owner Type
Purchase Details
Closed on
Mar 4, 2025
Sold by
Starr Destiny Rose
Bought by
Drs Trust and Starr
Current Estimated Value
Purchase Details
Closed on
Mar 19, 2021
Sold by
Paretich Michael Anthony
Bought by
Paretich Michael Anthony and Map Trust
Purchase Details
Closed on
Mar 14, 2021
Sold by
Paretich Michael Anthony and Paretich Family Trust
Bought by
Paretich Michael Anthony
Create a Home Valuation Report for This Property
The Home Valuation Report is an in-depth analysis detailing your home's value as well as a comparison with similar homes in the area
Home Values in the Area
Average Home Value in this Area
Purchase History
| Date | Buyer | Sale Price | Title Company |
|---|---|---|---|
| Drs Trust | -- | None Listed On Document | |
| Starr Destiny Rose | -- | None Listed On Document | |
| Paretich Michael Anthony | -- | None Available | |
| Paretich Michael Anthony | -- | None Available |
Source: Public Records
Tax History Compared to Growth
Tax History
| Year | Tax Paid | Tax Assessment Tax Assessment Total Assessment is a certain percentage of the fair market value that is determined by local assessors to be the total taxable value of land and additions on the property. | Land | Improvement |
|---|---|---|---|---|
| 2025 | $8,586 | $930,000 | $500,000 | $430,000 |
| 2024 | $8,586 | $450,344 | $225,172 | $225,172 |
| 2023 | $8,305 | $441,516 | $220,758 | $220,758 |
| 2022 | $7,944 | $432,858 | $216,429 | $216,429 |
| 2021 | $7,830 | $424,372 | $212,186 | $212,186 |
| 2020 | $7,732 | $420,022 | $210,011 | $210,011 |
| 2019 | $7,469 | $411,786 | $205,893 | $205,893 |
| 2018 | $7,401 | $403,714 | $201,857 | $201,857 |
| 2017 | $7,173 | $395,798 | $197,899 | $197,899 |
| 2016 | $6,928 | $388,038 | $194,019 | $194,019 |
| 2015 | $6,629 | $382,210 | $191,105 | $191,105 |
| 2014 | $6,311 | $374,724 | $187,362 | $187,362 |
Source: Public Records
Map
Nearby Homes