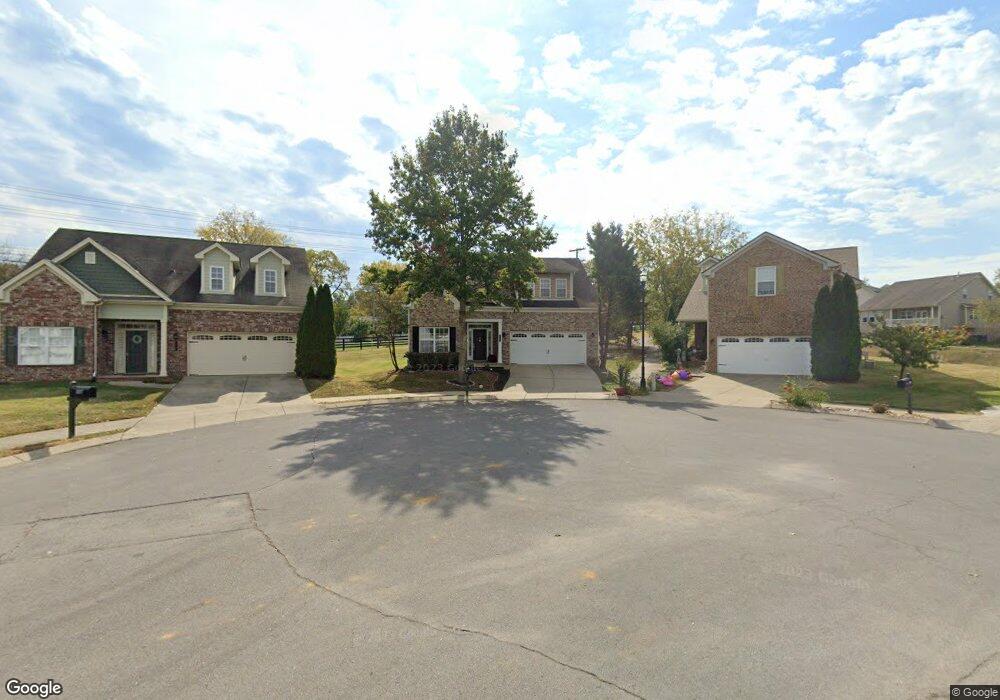
331 Dobson Branch Trail Nolensville, TN 37135
Estimated Value: $519,653 - $587,000
--
Bed
3
Baths
1,855
Sq Ft
$297/Sq Ft
Est. Value
About This Home
This home is located at 331 Dobson Branch Trail, Nolensville, TN 37135 and is currently estimated at $551,413, approximately $297 per square foot. 331 Dobson Branch Trail is a home located in Williamson County with nearby schools including Mill Creek Elementary School, Mill Creek Middle School, and Nolensville High School.
Ownership History
Date
Name
Owned For
Owner Type
Purchase Details
Closed on
Apr 27, 2022
Sold by
Sawhney Anil and Sawhney Sujana
Bought by
Db Baba Llc
Current Estimated Value
Purchase Details
Closed on
Sep 20, 2021
Sold by
Sawhney Anil and Sawhney Sujana
Bought by
Sawhney Anil and Sawhney Sujana
Home Financials for this Owner
Home Financials are based on the most recent Mortgage that was taken out on this home.
Original Mortgage
$348,750
Interest Rate
2.7%
Mortgage Type
New Conventional
Purchase Details
Closed on
Oct 6, 2006
Sold by
Westview Homes Llc
Bought by
Sawhney Anil and Gonuguntla Sujana
Home Financials for this Owner
Home Financials are based on the most recent Mortgage that was taken out on this home.
Original Mortgage
$149,900
Interest Rate
5.95%
Mortgage Type
Purchase Money Mortgage
Purchase Details
Closed on
Dec 22, 2005
Sold by
Ck Development Llc
Bought by
Westview Homes Llc
Create a Home Valuation Report for This Property
The Home Valuation Report is an in-depth analysis detailing your home's value as well as a comparison with similar homes in the area
Home Values in the Area
Average Home Value in this Area
Purchase History
| Date | Buyer | Sale Price | Title Company |
|---|---|---|---|
| Db Baba Llc | -- | Chapman & Rosenthal Title | |
| Sawhney Anil | -- | None Available | |
| Sawhney Anil | $253,410 | Mooreland Title Company Llc | |
| Westview Homes Llc | $582,706 | Mooreland Title |
Source: Public Records
Mortgage History
| Date | Status | Borrower | Loan Amount |
|---|---|---|---|
| Previous Owner | Sawhney Anil | $348,750 | |
| Previous Owner | Sawhney Anil | $149,900 |
Source: Public Records
Tax History Compared to Growth
Tax History
| Year | Tax Paid | Tax Assessment Tax Assessment Total Assessment is a certain percentage of the fair market value that is determined by local assessors to be the total taxable value of land and additions on the property. | Land | Improvement |
|---|---|---|---|---|
| 2025 | $1,827 | $131,400 | $42,500 | $88,900 |
| 2024 | $1,827 | $84,225 | $21,250 | $62,975 |
| 2023 | $1,827 | $84,225 | $21,250 | $62,975 |
| 2022 | $1,827 | $84,225 | $21,250 | $62,975 |
| 2021 | $1,827 | $84,225 | $21,250 | $62,975 |
| 2020 | $1,670 | $66,525 | $16,250 | $50,275 |
| 2019 | $1,577 | $66,525 | $16,250 | $50,275 |
| 2018 | $1,530 | $66,525 | $16,250 | $50,275 |
| 2017 | $1,517 | $66,525 | $16,250 | $50,275 |
| 2016 | $0 | $66,525 | $16,250 | $50,275 |
| 2015 | -- | $56,650 | $13,750 | $42,900 |
| 2014 | -- | $56,650 | $13,750 | $42,900 |
Source: Public Records
Map
Nearby Homes
- 244 Siegert Place
- 5030 Maxwell Landing Dr
- 208 Siegert Place
- 304 Thesing Ct
- 6191 Christmas Dr
- 5028 Burke Trail
- 9918 Sam Donald Rd
- 4800 Powder Springs Rd
- 4609 Van Leer Ct
- 4528 Sawmill Place
- 4592 Sawmill Place
- 104 Lodge Hall Rd
- 136 Madison Mill Dr
- 404 Lively Way
- 3236 Bradfield Dr
- 2105 Sugar Mill Dr
- 2036 Bocage Cir
- 143 Lodge Hall Rd
- 5100 Aunt Nannies Place
- 813 Stonebrook Blvd
- 335 Dobson Branch Trail
- 327 Dobson Branch Trail
- 327 Dobson Branch Trail Unit 327
- 340 Dobson Branch Trail
- 321 Dobson Branch Trail
- 336 Dobson Branch Trail
- 332 Dobson Branch Trail
- 328 Dobson Branch Trail
- 9857 Clovercroft Rd
- 657 Nevins Place
- 324 Dobson Branch Trail
- 656 Nevins Place
- 312 Dobson Branch Trail
- 320 Dobson Branch Trail
- 653 Nevins Place
- 311 Dobson Branch Trail
- 9853 Clovercroft Rd
- 652 Nevins Place
- 649 Nevins Place
- 649 Nevins Pl~lt#3111