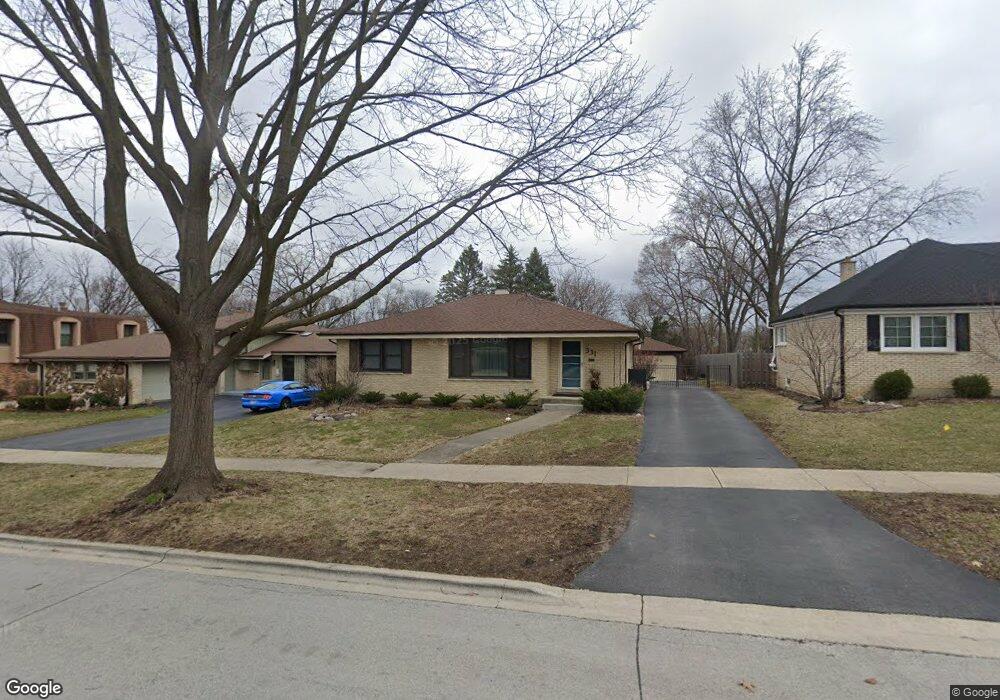
331 E Cayuga Ave Elmhurst, IL 60126
Estimated Value: $453,000 - $728,000
4
Beds
3
Baths
1,330
Sq Ft
$452/Sq Ft
Est. Value
About This Home
This home is located at 331 E Cayuga Ave, Elmhurst, IL 60126 and is currently estimated at $600,960, approximately $451 per square foot. 331 E Cayuga Ave is a home located in DuPage County with nearby schools including Jefferson Elementary School, Bryan Middle School, and York Community High School.
Ownership History
Date
Name
Owned For
Owner Type
Purchase Details
Closed on
Feb 23, 2022
Sold by
Amanda Ratliff
Bought by
Amanda Ratliff Trust
Current Estimated Value
Purchase Details
Closed on
Apr 17, 2017
Sold by
Marcordes Jean A and Bushman Jean A
Bought by
Ratliff Amanda C
Home Financials for this Owner
Home Financials are based on the most recent Mortgage that was taken out on this home.
Original Mortgage
$286,560
Interest Rate
4.21%
Mortgage Type
New Conventional
Purchase Details
Closed on
Apr 28, 2003
Sold by
Marcordes Stephen D and Marcordes Gerard Jean
Bought by
Marcordes Jean A
Home Financials for this Owner
Home Financials are based on the most recent Mortgage that was taken out on this home.
Original Mortgage
$220,000
Interest Rate
6.02%
Mortgage Type
Purchase Money Mortgage
Create a Home Valuation Report for This Property
The Home Valuation Report is an in-depth analysis detailing your home's value as well as a comparison with similar homes in the area
Home Values in the Area
Average Home Value in this Area
Purchase History
| Date | Buyer | Sale Price | Title Company |
|---|---|---|---|
| Amanda Ratliff Trust | -- | Alan E Lechowicz & Associates | |
| Ratliff Amanda C | $258,500 | Attorneys Title Guaranty Fun | |
| Marcordes Jean A | -- | Chicago Title Insurance Comp |
Source: Public Records
Mortgage History
| Date | Status | Borrower | Loan Amount |
|---|---|---|---|
| Previous Owner | Ratliff Amanda C | $286,560 | |
| Previous Owner | Marcordes Jean A | $220,000 |
Source: Public Records
Tax History
| Year | Tax Paid | Tax Assessment Tax Assessment Total Assessment is a certain percentage of the fair market value that is determined by local assessors to be the total taxable value of land and additions on the property. | Land | Improvement |
|---|---|---|---|---|
| 2024 | $8,748 | $153,159 | $106,875 | $46,284 |
| 2023 | $8,113 | $141,630 | $98,830 | $42,800 |
| 2022 | $7,890 | $136,120 | $94,990 | $41,130 |
| 2021 | $7,693 | $132,740 | $92,630 | $40,110 |
| 2020 | $7,394 | $129,830 | $90,600 | $39,230 |
| 2019 | $7,234 | $123,440 | $86,140 | $37,300 |
| 2018 | $7,482 | $126,780 | $81,550 | $45,230 |
| 2017 | $7,315 | $120,810 | $77,710 | $43,100 |
| 2016 | $7,157 | $113,810 | $73,210 | $40,600 |
| 2015 | $7,079 | $106,020 | $68,200 | $37,820 |
| 2014 | $7,125 | $98,460 | $54,130 | $44,330 |
| 2013 | $7,049 | $99,840 | $54,890 | $44,950 |
Source: Public Records
Map
Nearby Homes
- 274 E Crescent Ave
- 566 S Cedar Ave
- 788 S Cambridge Ave
- 580 S Kearsage Ave
- 160 E Cayuga Ave
- 494 E Atwood Ct
- 593 S Edgewood Ave
- 837 S Kearsage Ave
- 694 S York St
- 353 E Butterfield Rd
- 515 S Parkview Ave
- 323 E Butterfield Rd
- 251 E South St
- 522 E Park Manor Ct
- 918 S Cambridge Ave
- 224 E May St
- 857 S Euclid Ave
- 500 S Kenilworth Ave
- 2050 Atwood Ave
- 406 S Poplar Ave
- 337 E Cayuga Ave
- 327 E Cayuga Ave
- 341 E Cayuga Ave
- 321 E Cayuga Ave
- 332 E Cayuga Ave
- 326 E Cayuga Ave
- 317 E Cayuga Ave
- 347 E Cayuga Ave
- 338 E Cayuga Ave
- 689 S Poplar Ave
- 714 S Benton Ave
- 697 S Poplar Ave
- 705 S Benton Ave
- 305 E Cayuga Ave
- 717 S Benton Ave
- 306 E Wilson St
- 726 S Benton Ct
- 722 S Benton Ct
- 705 S Poplar Ave
- 297 E Cayuga Ave
Your Personal Tour Guide
Ask me questions while you tour the home.