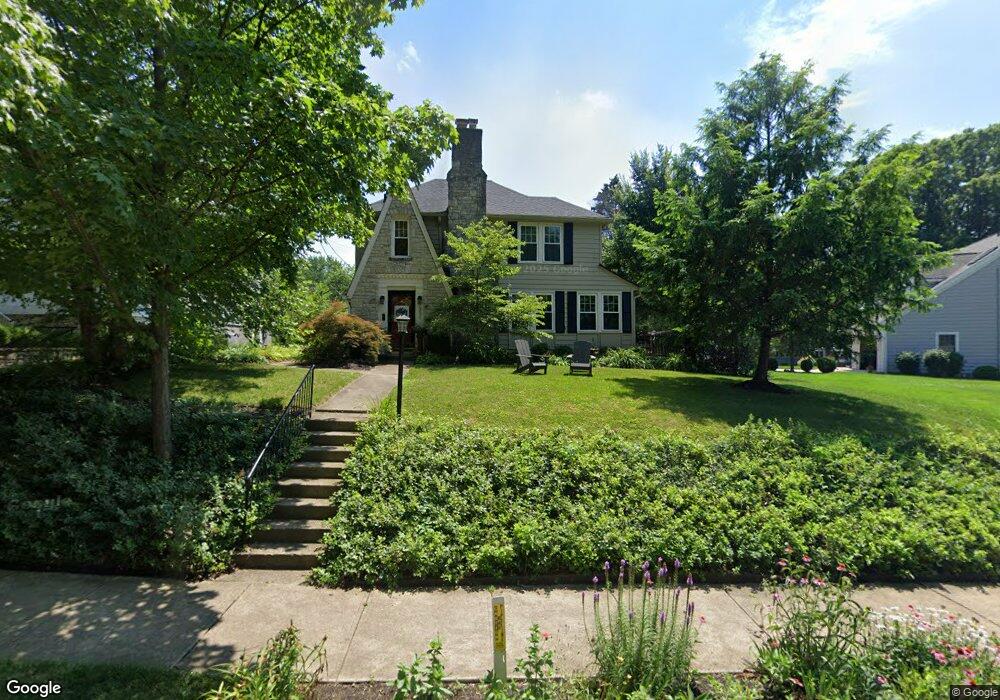
331 E Torrence Rd Columbus, OH 43214
Clintonville NeighborhoodEstimated Value: $516,000 - $639,000
3
Beds
2
Baths
1,539
Sq Ft
$370/Sq Ft
Est. Value
About This Home
This home is located at 331 E Torrence Rd, Columbus, OH 43214 and is currently estimated at $569,264, approximately $369 per square foot. 331 E Torrence Rd is a home located in Franklin County with nearby schools including Clinton Elementary School, Dominion Middle School, and Whetstone High School.
Ownership History
Date
Name
Owned For
Owner Type
Purchase Details
Closed on
Jul 17, 2009
Sold by
Buterbaugh Jeffrey S and Buterbaugh Nancy T
Bought by
Mcgory Julia T
Current Estimated Value
Home Financials for this Owner
Home Financials are based on the most recent Mortgage that was taken out on this home.
Original Mortgage
$125,000
Outstanding Balance
$81,525
Interest Rate
5.62%
Mortgage Type
Purchase Money Mortgage
Estimated Equity
$487,739
Purchase Details
Closed on
Dec 28, 1998
Sold by
Kura Darlene A
Bought by
Buterbaugh Jeffrey S and Buterbaugh Nancy T
Home Financials for this Owner
Home Financials are based on the most recent Mortgage that was taken out on this home.
Original Mortgage
$179,100
Interest Rate
6.95%
Purchase Details
Closed on
Jan 17, 1995
Sold by
Newman Lawrence W
Bought by
Kura James P and Kura Darlene A
Home Financials for this Owner
Home Financials are based on the most recent Mortgage that was taken out on this home.
Original Mortgage
$75,000
Interest Rate
8.13%
Mortgage Type
New Conventional
Create a Home Valuation Report for This Property
The Home Valuation Report is an in-depth analysis detailing your home's value as well as a comparison with similar homes in the area
Home Values in the Area
Average Home Value in this Area
Purchase History
| Date | Buyer | Sale Price | Title Company |
|---|---|---|---|
| Mcgory Julia T | $242,500 | Stewart Tit | |
| Buterbaugh Jeffrey S | $199,000 | Franklin Abstract | |
| Kura James P | $150,000 | -- |
Source: Public Records
Mortgage History
| Date | Status | Borrower | Loan Amount |
|---|---|---|---|
| Open | Mcgory Julia T | $125,000 | |
| Previous Owner | Buterbaugh Jeffrey S | $179,100 | |
| Previous Owner | Kura James P | $75,000 |
Source: Public Records
Tax History
| Year | Tax Paid | Tax Assessment Tax Assessment Total Assessment is a certain percentage of the fair market value that is determined by local assessors to be the total taxable value of land and additions on the property. | Land | Improvement |
|---|---|---|---|---|
| 2025 | $7,128 | $158,830 | $56,980 | $101,850 |
| 2024 | $7,128 | $158,830 | $56,980 | $101,850 |
| 2023 | $7,015 | $158,340 | $56,980 | $101,360 |
| 2022 | $8,661 | $166,990 | $44,940 | $122,050 |
| 2021 | $8,676 | $166,990 | $44,940 | $122,050 |
| 2020 | $8,687 | $166,990 | $44,940 | $122,050 |
| 2019 | $7,790 | $128,420 | $34,580 | $93,840 |
| 2018 | $6,594 | $128,420 | $34,580 | $93,840 |
| 2017 | $6,874 | $128,420 | $34,580 | $93,840 |
| 2016 | $5,963 | $90,020 | $34,650 | $55,370 |
| 2015 | $5,413 | $90,020 | $34,650 | $55,370 |
| 2014 | $5,426 | $90,020 | $34,650 | $55,370 |
| 2013 | $2,550 | $85,750 | $33,005 | $52,745 |
Source: Public Records
Map
Nearby Homes
- 467 Brevoort Rd
- 374 Acton Rd
- 531 Richards Rd
- 107 E Dunedin Rd
- 440 Chatham Rd
- 544 Piedmont Rd
- 30 E Torrence Rd
- 37 Glencoe Rd
- 188 Chatham Rd
- 83 Clinton Heights Ave
- 82 Blenheim Rd
- 76 E Lakeview Ave
- 589 Clinton Heights Ave
- 296 Walhalla Rd
- 126 Erie Rd
- 3546 Beulah Rd
- 84-86 W Como Ave
- 196 W North Broadway St
- 44 W Pacemont Rd
- 123 W Como Ave
- 339 E Torrence Rd
- 317 E Torrence Rd
- 345 E Torrence Rd
- 318 Brevoort Rd
- 353 E Torrence Rd
- 310 Brevoort Rd
- 334 Brevoort Rd
- 330 E Torrence Rd
- 336 E Torrence Rd
- 322 E Torrence Rd
- 344 E Torrence Rd
- 298 Brevoort Rd
- 318 E Torrence Rd
- 357 E Torrence Rd
- 350 E Torrence Rd
- 340 Brevoort Rd
- 310 E Torrence Rd
- 292 Brevoort Rd
- 3611 Calumet St
- 356 E Torrence Rd
Your Personal Tour Guide
Ask me questions while you tour the home.