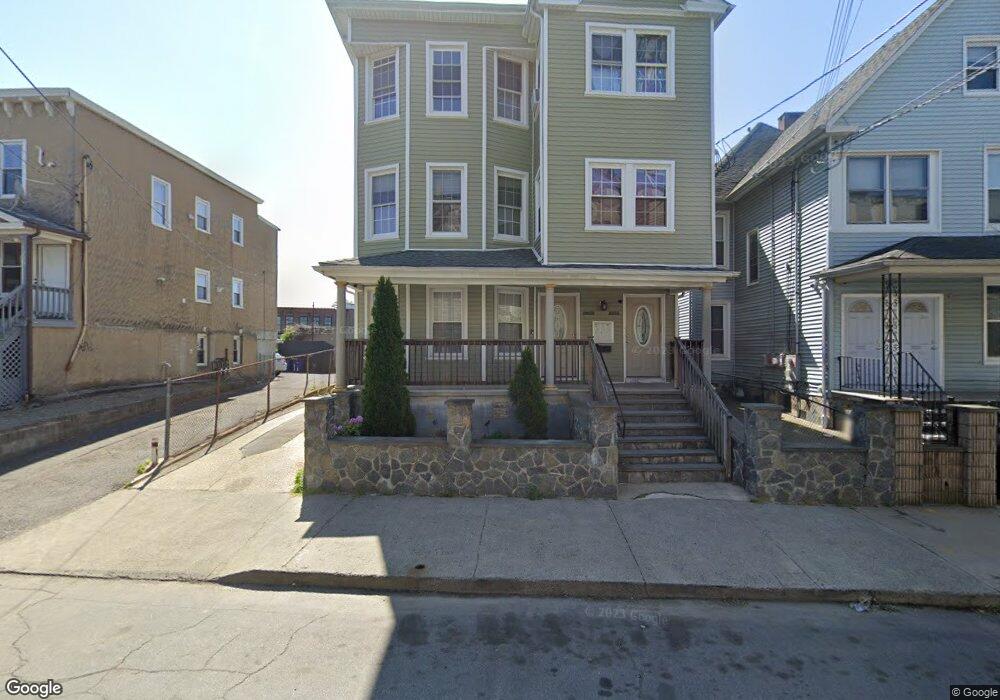
331 George St Unit 335 Bridgeport, CT 06604
The Hollow NeighborhoodEstimated Value: $511,000 - $649,000
6
Beds
3
Baths
3,216
Sq Ft
$178/Sq Ft
Est. Value
About This Home
This home is located at 331 George St Unit 335, Bridgeport, CT 06604 and is currently estimated at $572,667, approximately $178 per square foot. 331 George St Unit 335 is a home located in Fairfield County with nearby schools including Bassick High School, Catholic Academy of Bridgeport-St. Raphael Academy, and Catholic Academy of Bridgeport-St. Augustine Academy.
Ownership History
Date
Name
Owned For
Owner Type
Purchase Details
Closed on
Mar 6, 2018
Sold by
Usa Hd
Bought by
Gayle Anthony and Gayle Ifeseyi
Current Estimated Value
Home Financials for this Owner
Home Financials are based on the most recent Mortgage that was taken out on this home.
Original Mortgage
$280,912
Outstanding Balance
$238,749
Interest Rate
4.04%
Mortgage Type
Unknown
Estimated Equity
$333,918
Purchase Details
Closed on
Dec 9, 2013
Sold by
Lopez Jose
Bought by
Jp Morgan Chase Bank N
Purchase Details
Closed on
Jul 8, 2003
Sold by
Spinelli Paul
Bought by
Lopez Jose E
Purchase Details
Closed on
Jun 7, 2002
Sold by
Department Of Housing & Urban Dev
Bought by
Spinelli Paul
Purchase Details
Closed on
Dec 29, 1998
Sold by
Alves Benjamin
Bought by
Dodaj Vera
Create a Home Valuation Report for This Property
The Home Valuation Report is an in-depth analysis detailing your home's value as well as a comparison with similar homes in the area
Home Values in the Area
Average Home Value in this Area
Purchase History
| Date | Buyer | Sale Price | Title Company |
|---|---|---|---|
| Gayle Anthony | $275,000 | -- | |
| Gayle Anthony | $275,000 | -- | |
| Jp Morgan Chase Bank N | -- | -- | |
| Jp Morgan Chase Bank N | -- | -- | |
| Lopez Jose E | $240,000 | -- | |
| Lopez Jose E | $240,000 | -- | |
| Spinelli Paul | $70,150 | -- | |
| Spinelli Paul | $70,150 | -- | |
| Dodaj Vera | $87,000 | -- | |
| Dodaj Vera | $87,000 | -- |
Source: Public Records
Mortgage History
| Date | Status | Borrower | Loan Amount |
|---|---|---|---|
| Open | Dodaj Vera | $280,912 | |
| Closed | Dodaj Vera | $280,912 |
Source: Public Records
Tax History Compared to Growth
Tax History
| Year | Tax Paid | Tax Assessment Tax Assessment Total Assessment is a certain percentage of the fair market value that is determined by local assessors to be the total taxable value of land and additions on the property. | Land | Improvement |
|---|---|---|---|---|
| 2025 | $9,089 | $209,180 | $42,810 | $166,370 |
| 2024 | $9,089 | $209,180 | $42,810 | $166,370 |
| 2023 | $9,089 | $209,180 | $42,810 | $166,370 |
| 2022 | $9,089 | $209,180 | $42,810 | $166,370 |
| 2021 | $9,089 | $209,180 | $42,810 | $166,370 |
| 2020 | $8,061 | $149,310 | $20,270 | $129,040 |
| 2019 | $8,061 | $149,310 | $20,270 | $129,040 |
| 2018 | $9,738 | $179,100 | $20,270 | $158,830 |
| 2017 | $9,738 | $179,100 | $20,270 | $158,830 |
| 2016 | $9,738 | $179,100 | $20,270 | $158,830 |
| 2015 | $9,296 | $220,280 | $42,200 | $178,080 |
| 2014 | $9,296 | $220,280 | $42,200 | $178,080 |
Source: Public Records
Map
Nearby Homes
- 183 Calhoun Ave
- 318 Center St
- 191 Oak St
- 139 Highland Ave Unit 143
- 75 Sanford Ave
- 309 Pequonnock St
- 120 Milne St Unit 122
- 113 Milne St Unit 115
- 213 Harral Ave Unit 215
- 200 Harral Ave
- 100 Lorraine St
- 78 Fairmount Ave
- 90 Tom Thumb St
- 1373 Iranistan Ave
- 826 Norman St
- 31 Taft Ave
- 1872 North Ave Unit 1874
- 1199 Iranistan Ave Unit 1201
- 592 Norman St Unit 594
- 76 Porter St
- 341 George St Unit 343
- 329 George St
- 22 Oak St
- 317 George St
- 12-16 Oak St
- 12 Oak St Unit 3
- 12 Oak St Unit 16
- 305 George St Unit 307
- 6 Oak St
- 270 Lexington Ave
- 266 Lexington Ave
- 264 Lexington Ave Unit 266
- 256 Lexington Ave Unit 2
- 245 Center St Unit 247
- 10 Oak St
- 285 Lexington Ave Unit 289
- 273 Lexington Ave
- 209 Center St
- 317 Center St