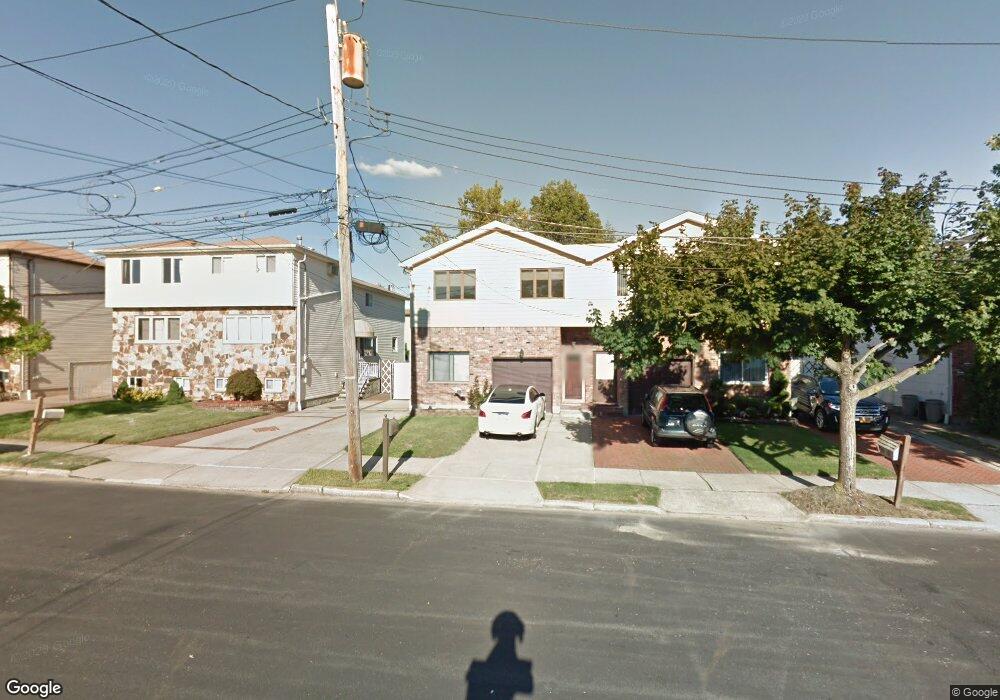
331 Getz Ave Staten Island, NY 10312
Eltingville NeighborhoodEstimated Value: $876,000 - $1,014,000
3
Beds
2
Baths
2,152
Sq Ft
$428/Sq Ft
Est. Value
About This Home
This home is located at 331 Getz Ave, Staten Island, NY 10312 and is currently estimated at $921,408, approximately $428 per square foot. 331 Getz Ave is a home located in Richmond County with nearby schools including P.S. 42 The Eltingville School, I.S. 007 Elias Bernstein, and Tottenville High School.
Ownership History
Date
Name
Owned For
Owner Type
Purchase Details
Closed on
Mar 19, 2025
Sold by
Guissarri Joanne
Bought by
Joanne Guissarri Revocable Asset Management F and Guissarri
Current Estimated Value
Purchase Details
Closed on
Aug 17, 2007
Sold by
Gustafson Richard T and Gustafson Michele E
Bought by
Guissarri Joanne
Home Financials for this Owner
Home Financials are based on the most recent Mortgage that was taken out on this home.
Original Mortgage
$300,000
Interest Rate
6.74%
Mortgage Type
Purchase Money Mortgage
Purchase Details
Closed on
Jul 28, 1998
Sold by
Kist William C and Kist Janet
Bought by
Gustafson Richard T and Scafuri Michele E
Home Financials for this Owner
Home Financials are based on the most recent Mortgage that was taken out on this home.
Original Mortgage
$196,500
Interest Rate
6.9%
Create a Home Valuation Report for This Property
The Home Valuation Report is an in-depth analysis detailing your home's value as well as a comparison with similar homes in the area
Home Values in the Area
Average Home Value in this Area
Purchase History
| Date | Buyer | Sale Price | Title Company |
|---|---|---|---|
| Joanne Guissarri Revocable Asset Management F | -- | Bentley Abstract | |
| Guissarri Joanne | $550,000 | Fidelity Natl Title Ins Co | |
| Gustafson Richard T | $218,500 | Ticor Title Guarantee Compan |
Source: Public Records
Mortgage History
| Date | Status | Borrower | Loan Amount |
|---|---|---|---|
| Previous Owner | Guissarri Joanne | $300,000 | |
| Previous Owner | Gustafson Richard T | $196,500 |
Source: Public Records
Tax History Compared to Growth
Tax History
| Year | Tax Paid | Tax Assessment Tax Assessment Total Assessment is a certain percentage of the fair market value that is determined by local assessors to be the total taxable value of land and additions on the property. | Land | Improvement |
|---|---|---|---|---|
| 2025 | $7,599 | $53,460 | $8,122 | $45,338 |
| 2024 | $7,611 | $48,000 | $8,534 | $39,466 |
| 2023 | $7,233 | $37,015 | $7,311 | $29,704 |
| 2022 | $6,684 | $47,400 | $10,440 | $36,960 |
| 2021 | $7,046 | $45,120 | $10,440 | $34,680 |
| 2020 | $7,040 | $43,020 | $10,440 | $32,580 |
| 2019 | $6,547 | $41,220 | $10,440 | $30,780 |
| 2018 | $5,990 | $30,846 | $9,533 | $21,313 |
| 2017 | $5,632 | $29,100 | $10,440 | $18,660 |
| 2016 | $6,302 | $33,072 | $10,425 | $22,647 |
| 2015 | $5,395 | $31,200 | $8,700 | $22,500 |
| 2014 | $5,395 | $29,700 | $8,700 | $21,000 |
Source: Public Records
Map
Nearby Homes
- 219 Eltingville Blvd
- 280 Eltingville Blvd
- 284 Eltingville Blvd
- 288 Eltingville Blvd
- 292 Eltingville Blvd
- 1 Patty Ct
- 32 Ovas Ct
- 296 Eltingville Blvd
- 320 Genesee Ave
- 420 Getz Ave
- 254 Ridgewood Ave
- 212 Cortelyou Ave
- 0 Getz Ave
- 166 Genesee Ave
- 41 Middle Loop Rd
- 57 Middle Loop Rd
- 634 Leverett Ave
- 3452 Richmond Ave
- 696 Katan Ave
- 538 Leverett Ave