
Seller's Agent in 2026
Ben Henrikson
RE/MAX
(847) 931-7500
8 in this area
116 Total Sales
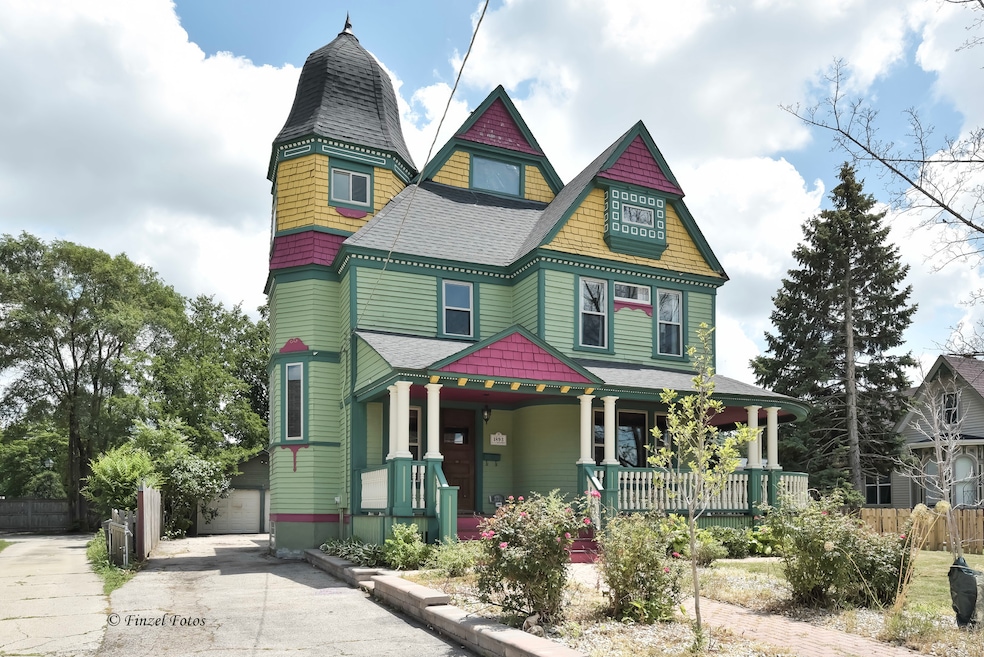

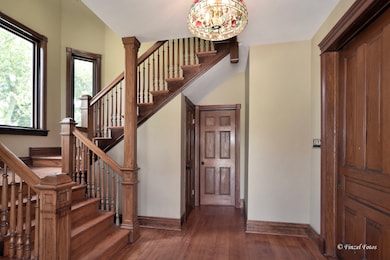
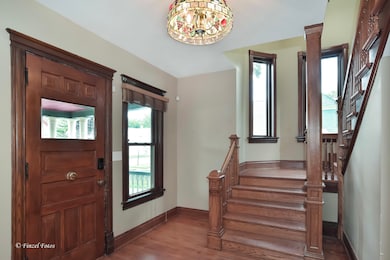
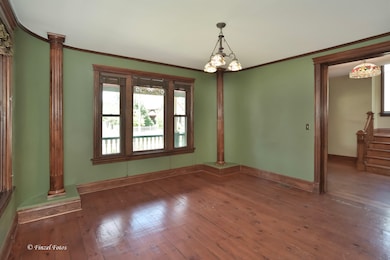
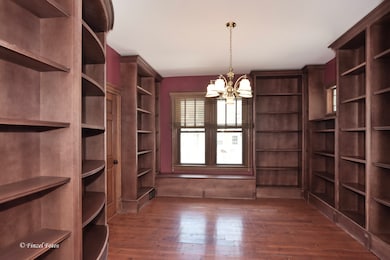
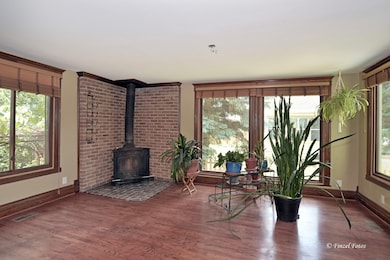
GORGEOUS WEST-SIDE PLAQUED PAINTED LADY WITH FOUR LEVELS OF LIVING SPACE. BUILT IN 1893 FOR A&A KROGSRUD, AN EMPLOYEE OF ELGINS WATCH CO. THIS HOME HAS BEEN MODERNIZED WHILE KEEPING THE ORIGINAL FEATURES. ORIGINAL HARDWOOD FLOORS AND MILLWORK TROUGHOUT, PILLARS, CROWN, POCKET DOORS, OPEN STAIRCASE AND STAINED GLASS ARE JUST SOME OF THE FEATURES. WRAP AROUND FRONT PORCH WITH SEPARATE DOOR FROM DINING ROOM. LIBRARY ROOM WITH COMPLETE FLOOR TO CEILING BOOKSHELVES ON ALL WALLS. FAMILY ROOM WITH WB FIREPLACE AND PICTURE WINDOWS OVERLOOKING YARD. FRONT AND REAR STAIRCASES TO BOTH 2ND LEVEL AND BASEMENT. BEAUTIFUL KITCHEN WITH CUSTOM CABINETS AND GRANITE COUNTERS. FULLY FINISHED BASEMENT WITH MEDIA ROOM/WET BAR, BATH AND CELLAR DOOR. MASTER SUITE ON 3RD LEVEL WITH VAULTED CEILINGS, THREE SKYLIGHTS, SITTING ROOM, WALK-IN CLOSET, TURRET ROOM WITH WHIRLPOOL BATH. UPDATED KITCHEN AND ALL FIVE BATHS UPDATED. HOME HAS NEWER WINDOWS THROUGHOUT, NEWER ROOF (2020), UPDATED PLUMBING AND ELECTRIC, 2 GFA FURNACES WITH CENTRAL AIR, RADON MITIGATION SYSTEM AND ADDT'L INSULATION INSTALLED.
Last Agent to Sell the Property
RE/MAX Horizon License #475091643 Listed on: 07/01/2025
| Date | Type | Sale Price | Title Company |
|---|---|---|---|
| Warranty Deed | $420,000 | None Listed On Document | |
| Warranty Deed | $88,000 | Attorneys Title Guaranty Fun | |
| Warranty Deed | $189,000 | First American Title | |
| Quit Claim Deed | -- | Ticor Title Ins Co 1998 | |
| Special Warranty Deed | $68,000 | Attorneys Title Guaranty Fun | |
| Sheriffs Deed | -- | None Available | |
| Special Warranty Deed | $214,000 | First American Title | |
| Sheriffs Deed | -- | None Available | |
| Warranty Deed | $251,000 | Chicago Title Insurance Comp | |
| Warranty Deed | $203,000 | Ticor Title Insurance | |
| Warranty Deed | $160,000 | Chicago Title Insurance Co |
| Date | Status | Loan Amount | Loan Type |
|---|---|---|---|
| Open | $399,000 | New Conventional | |
| Previous Owner | $171,120 | Purchase Money Mortgage | |
| Previous Owner | $251,000 | Purchase Money Mortgage | |
| Previous Owner | $182,700 | No Value Available | |
| Previous Owner | $152,000 | No Value Available |
| Date | Event | Price | List to Sale | Price per Sq Ft |
|---|---|---|---|---|
| 01/14/2026 01/14/26 | Sold | $420,000 | -8.7% | $103 / Sq Ft |
| 12/15/2025 12/15/25 | Pending | -- | -- | -- |
| 10/15/2025 10/15/25 | Price Changed | $459,900 | -4.2% | $113 / Sq Ft |
| 08/22/2025 08/22/25 | Price Changed | $479,900 | -4.0% | $118 / Sq Ft |
| 07/25/2025 07/25/25 | Price Changed | $499,900 | -4.8% | $123 / Sq Ft |
| 07/01/2025 07/01/25 | For Sale | $525,000 | -- | $129 / Sq Ft |
| Year | Tax Paid | Tax Assessment Tax Assessment Total Assessment is a certain percentage of the fair market value that is determined by local assessors to be the total taxable value of land and additions on the property. | Land | Improvement |
|---|---|---|---|---|
| 2024 | $7,256 | $90,664 | $17,499 | $73,165 |
| 2023 | $6,300 | $81,908 | $15,809 | $66,099 |
| 2022 | $5,956 | $74,686 | $14,415 | $60,271 |
| 2021 | $5,694 | $69,826 | $13,477 | $56,349 |
| 2020 | $6,549 | $77,809 | $12,866 | $64,943 |
| 2019 | $6,362 | $74,118 | $12,256 | $61,862 |
| 2018 | $6,310 | $69,824 | $11,546 | $58,278 |
| 2017 | $6,172 | $66,009 | $10,915 | $55,094 |
| 2016 | $5,891 | $61,238 | $10,126 | $51,112 |
| 2015 | -- | $56,130 | $9,281 | $46,849 |
| 2014 | -- | $55,437 | $9,166 | $46,271 |
| 2013 | -- | $56,900 | $9,408 | $47,492 |
Seller's Agent in 2026
Ben Henrikson
RE/MAX
(847) 931-7500
8 in this area
116 Total Sales
Buyer's Agent in 2026
Elizabeth Goodchild
Realty of America
(847) 691-2976
1 in this area
545 Total Sales
Buyer Co-Listing Agent in 2026
Gus Gates
Realty of America
(847) 323-6887
1 in this area
14 Total Sales
Source: Midwest Real Estate Data (MRED)
MLS Number: 12407164
APN: 06-23-232-007
Disclaimer: Certain information contained herein is derived from information provided by parties other than Homes.com. All information provided is deemed reliable, but is not guaranteed to be accurate and should be independently verified.
![]() Based on information submitted to the MLS GRID. All data is obtained from various sources and may not have been verified by broker or MLS GRID. Supplied Open House Information is subject to change without notice. All information should be independently reviewed and verified for accuracy. Properties may or may not be listed by the office/agent presenting the information. Some IDX listings have been excluded from this website.
Based on information submitted to the MLS GRID. All data is obtained from various sources and may not have been verified by broker or MLS GRID. Supplied Open House Information is subject to change without notice. All information should be independently reviewed and verified for accuracy. Properties may or may not be listed by the office/agent presenting the information. Some IDX listings have been excluded from this website.
Based on information submitted to the MLS GRID
Ask me questions while you tour the home.