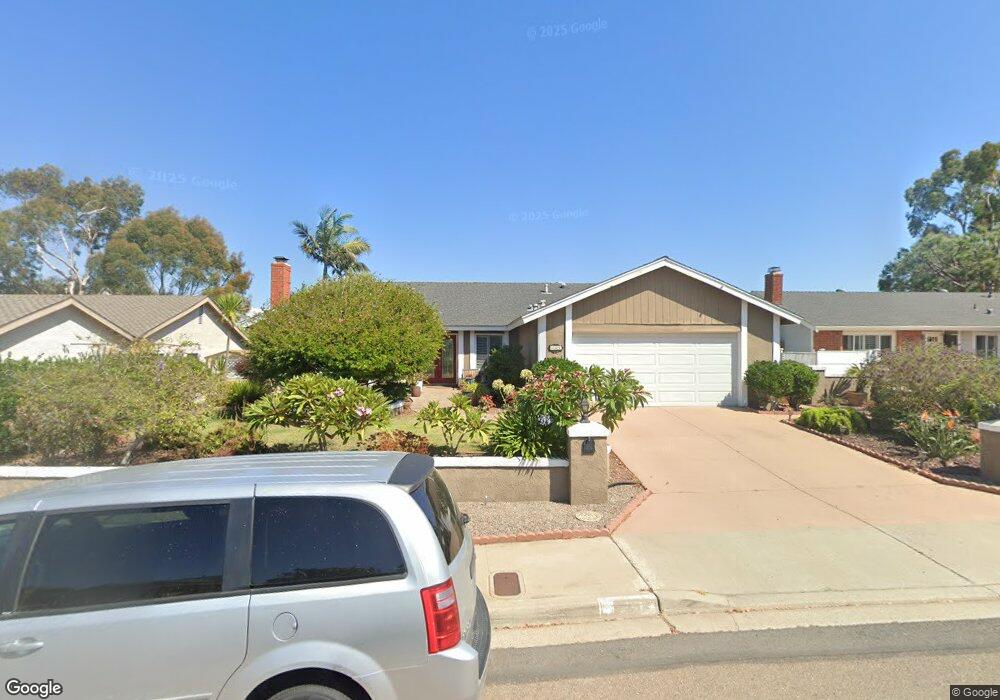
331 Hickoryhill Dr Encinitas, CA 92024
Central Encinitas NeighborhoodEstimated Value: $1,683,000 - $2,272,000
4
Beds
2
Baths
1,983
Sq Ft
$1,000/Sq Ft
Est. Value
About This Home
This home is located at 331 Hickoryhill Dr, Encinitas, CA 92024 and is currently estimated at $1,982,749, approximately $999 per square foot. 331 Hickoryhill Dr is a home located in San Diego County with nearby schools including Ocean Knoll Elementary School, Oak Crest Middle School, and La Costa Canyon High School.
Ownership History
Date
Name
Owned For
Owner Type
Purchase Details
Closed on
May 1, 2017
Sold by
Morrell Robert H and Morrell Susie M
Bought by
Morrell Robert Henry and Morrell Susie Moreno
Current Estimated Value
Purchase Details
Closed on
Dec 13, 1999
Sold by
Fairchild William H
Bought by
Morrell Robert H and Morrell Susie M
Home Financials for this Owner
Home Financials are based on the most recent Mortgage that was taken out on this home.
Original Mortgage
$252,700
Interest Rate
7.45%
Purchase Details
Closed on
Oct 30, 1996
Sold by
Porras Joseph A and Porras Nancy C
Bought by
Fairchild William H
Purchase Details
Closed on
Jul 24, 1989
Purchase Details
Closed on
Mar 1, 1988
Purchase Details
Closed on
Sep 18, 1985
Create a Home Valuation Report for This Property
The Home Valuation Report is an in-depth analysis detailing your home's value as well as a comparison with similar homes in the area
Home Values in the Area
Average Home Value in this Area
Purchase History
| Date | Buyer | Sale Price | Title Company |
|---|---|---|---|
| Morrell Robert Henry | -- | None Available | |
| Morrell Robert H | $329,000 | Guardian Title Company | |
| Fairchild William H | $59,041 | Old Republic Title Company | |
| -- | $272,000 | -- | |
| -- | $170,000 | -- | |
| -- | $137,000 | -- |
Source: Public Records
Mortgage History
| Date | Status | Borrower | Loan Amount |
|---|---|---|---|
| Closed | Morrell Robert H | $252,700 |
Source: Public Records
Tax History
| Year | Tax Paid | Tax Assessment Tax Assessment Total Assessment is a certain percentage of the fair market value that is determined by local assessors to be the total taxable value of land and additions on the property. | Land | Improvement |
|---|---|---|---|---|
| 2025 | $5,776 | $505,639 | $230,533 | $275,106 |
| 2024 | $5,776 | $495,725 | $226,013 | $269,712 |
| 2023 | $5,594 | $486,006 | $221,582 | $264,424 |
| 2022 | $5,449 | $476,478 | $217,238 | $259,240 |
| 2021 | $5,346 | $467,136 | $212,979 | $254,157 |
| 2020 | $5,249 | $462,347 | $210,796 | $251,551 |
| 2019 | $5,146 | $453,282 | $206,663 | $246,619 |
| 2018 | $5,049 | $444,395 | $202,611 | $241,784 |
| 2017 | $4,963 | $435,683 | $198,639 | $237,044 |
| 2016 | $4,811 | $427,142 | $194,745 | $232,397 |
| 2015 | $4,717 | $420,727 | $191,820 | $228,907 |
| 2014 | $4,602 | $412,487 | $188,063 | $224,424 |
Source: Public Records
Map
Nearby Homes
- 0 Crest Dr Unit 250045003
- 608 Crest Dr
- 1280 Santa fe Dr
- 1528 Calle Narcisos
- 1010 Scarlet Way
- 110 Turner Ave
- 1025 Monterey Vista Way
- 1011 Monterey Vista Way
- 1549 Avenida de Las Adelsas
- 363 Orwell Ln
- 246 Via Tavira
- 1240 Berryman Canyon
- 1386 Lake Dr
- 1517 Shields Ave
- 803 Hollyridge Dr
- 1862 Pleasantdale Ln
- 224 Seeman Dr
- 1341 Berryman Canyon
- 1331 Berryman Canyon
- 760 Bonita Dr
- 339 Hickoryhill Dr
- 323 Hickoryhill Dr
- 347 Hickoryhill Dr
- 315 Hickoryhill Dr
- 332 Hickoryhill Dr
- 355 Hickoryhill Dr
- 307 Hickoryhill Dr
- 324 Hickoryhill Dr
- 1377 Cherrytree Ct
- 316 Hickoryhill Dr
- 343 Sprucewood Dr
- 335 Sprucewood Dr
- 351 Sprucewood Dr
- 363 Hickoryhill Dr
- 723 Doris Dr
- 327 Sprucewood Dr
- 359 Sprucewood Dr
- 1369 Cherrytree Ct
- 1363 Cherrytree Ct
- 1382 Ahlrich Ave
Your Personal Tour Guide
Ask me questions while you tour the home.