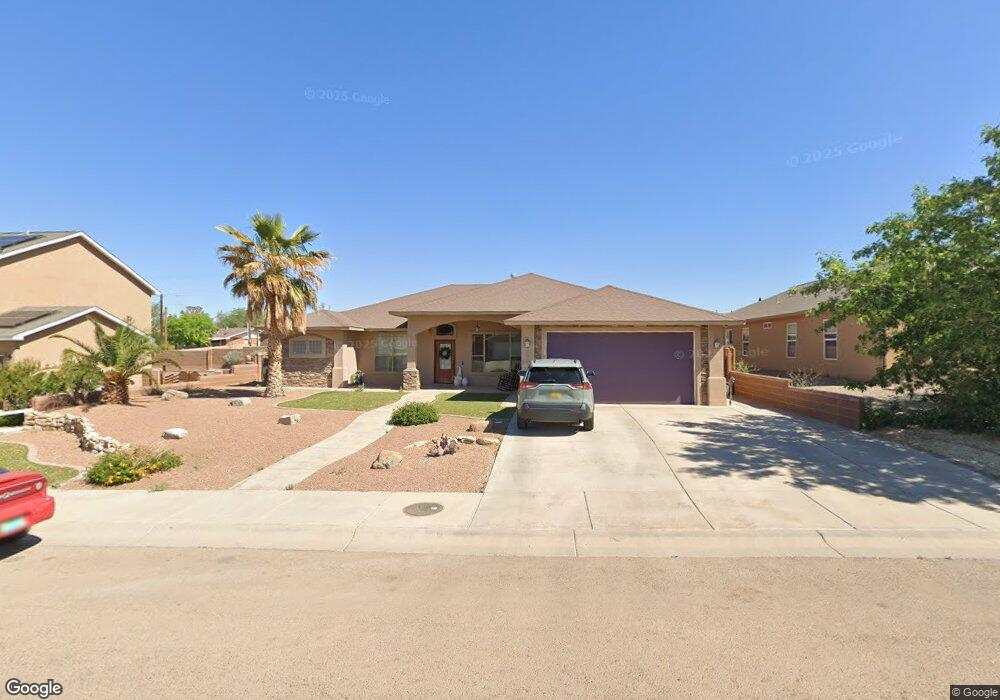
331 Palo Duro Unit 2 Alamogordo, NM 88310
Estimated Value: $362,000 - $451,000
4
Beds
2
Baths
2,342
Sq Ft
$174/Sq Ft
Est. Value
About This Home
This home is located at 331 Palo Duro Unit 2, Alamogordo, NM 88310 and is currently estimated at $408,358, approximately $174 per square foot. 331 Palo Duro Unit 2 is a home located in Otero County with nearby schools including Yucca Elementary School, Mountain View Middle School, and Alamogordo High School.
Ownership History
Date
Name
Owned For
Owner Type
Purchase Details
Closed on
Apr 22, 2021
Sold by
Hall Jason R and Hall Theresa C
Bought by
Chapman Brandon and Chapman Tamara
Current Estimated Value
Home Financials for this Owner
Home Financials are based on the most recent Mortgage that was taken out on this home.
Original Mortgage
$345,774
Outstanding Balance
$312,691
Interest Rate
3.1%
Mortgage Type
VA
Estimated Equity
$95,667
Purchase Details
Closed on
Aug 4, 2011
Sold by
Hall Jason R
Bought by
Hall Jason R and Papa Theresa Camille
Home Financials for this Owner
Home Financials are based on the most recent Mortgage that was taken out on this home.
Original Mortgage
$284,998
Interest Rate
4.53%
Mortgage Type
VA
Purchase Details
Closed on
Jul 29, 2011
Sold by
Melendez Joram
Bought by
Hall Jason R
Home Financials for this Owner
Home Financials are based on the most recent Mortgage that was taken out on this home.
Original Mortgage
$284,998
Interest Rate
4.53%
Mortgage Type
VA
Create a Home Valuation Report for This Property
The Home Valuation Report is an in-depth analysis detailing your home's value as well as a comparison with similar homes in the area
Home Values in the Area
Average Home Value in this Area
Purchase History
| Date | Buyer | Sale Price | Title Company |
|---|---|---|---|
| Chapman Brandon | -- | Pioneer Abstract & Ttl Co Of | |
| Hall Jason R | -- | None Available | |
| Hall Jason R | -- | None Available |
Source: Public Records
Mortgage History
| Date | Status | Borrower | Loan Amount |
|---|---|---|---|
| Open | Chapman Brandon | $345,774 | |
| Previous Owner | Hall Jason R | $284,998 |
Source: Public Records
Tax History Compared to Growth
Tax History
| Year | Tax Paid | Tax Assessment Tax Assessment Total Assessment is a certain percentage of the fair market value that is determined by local assessors to be the total taxable value of land and additions on the property. | Land | Improvement |
|---|---|---|---|---|
| 2025 | $3,017 | $122,403 | $12,353 | $110,050 |
| 2024 | $3,017 | $118,838 | $11,776 | $107,062 |
| 2023 | $2,982 | $115,377 | $11,161 | $104,216 |
| 2022 | $2,916 | $112,017 | $11,161 | $100,856 |
| 2021 | $2,479 | $94,089 | $11,161 | $82,928 |
| 2020 | $2,479 | $94,089 | $11,161 | $82,928 |
| 2019 | $2,445 | $92,244 | $10,942 | $81,302 |
| 2018 | $2,380 | $91,330 | $11,255 | $80,066 |
| 2017 | $2,190 | $89,540 | $11,035 | $78,496 |
| 2016 | $2,131 | $87,784 | $0 | $0 |
| 2015 | $2,088 | $86,063 | $0 | $0 |
| 2014 | -- | $84,377 | $10,400 | $73,977 |
Source: Public Records
Map
Nearby Homes
- 344 Palo Duro
- 315 Bosque
- 286 Bosque
- 243 Eagle Dr
- 269 Bosque
- 2774 Birdie Loop
- 431 Palo Duro
- 474 Eagle Dr
- 232 Palo Duro
- 2845 Birdie Loop
- 207 Palo Duro
- 2472 Sedona Ridge
- 0 Hamilton Rd
- 2443 Desert Hills Dr
- 2642 Tres Lagos
- 2416 Sedona Ridge
- 724 Eagle Dr
- 2413 Tres Lagos
- 5 Escopeta Ct
- 222 Hamilton Ridge Ave