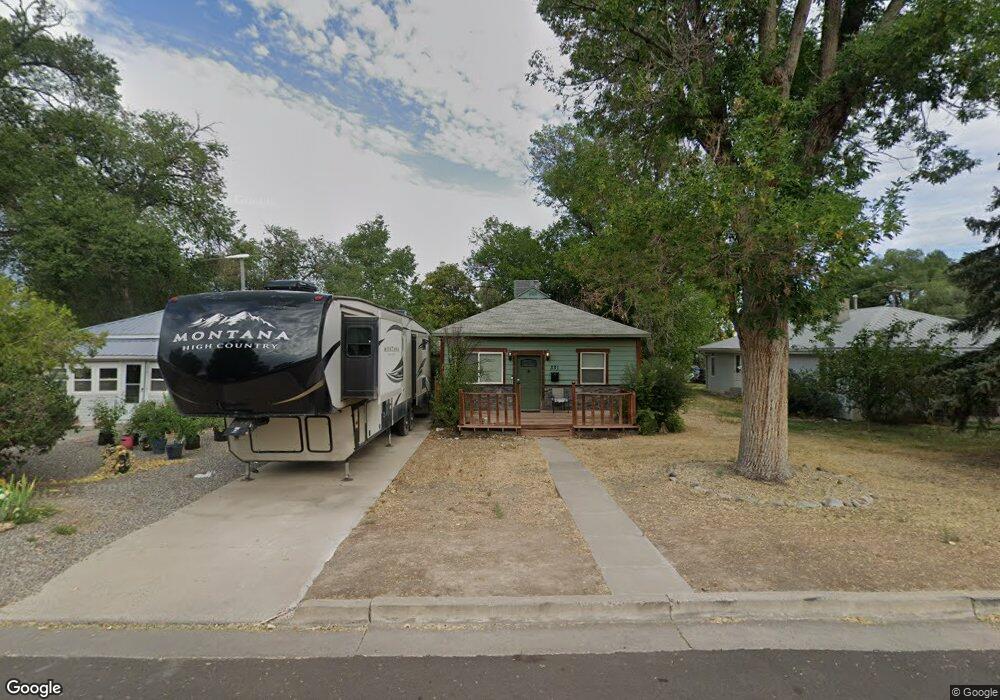
331 S 8th St Montrose, CO 81401
Estimated Value: $209,000 - $336,000
2
Beds
1
Bath
984
Sq Ft
$281/Sq Ft
Est. Value
About This Home
This home is located at 331 S 8th St, Montrose, CO 81401 and is currently estimated at $276,782, approximately $281 per square foot. 331 S 8th St is a home located in Montrose County with nearby schools including Pomona Elementary School, Centennial Middle School, and Montrose High School.
Ownership History
Date
Name
Owned For
Owner Type
Purchase Details
Closed on
Nov 28, 2018
Sold by
Copeland and Copeland
Bought by
Rexford Jeneen Renee
Current Estimated Value
Home Financials for this Owner
Home Financials are based on the most recent Mortgage that was taken out on this home.
Original Mortgage
$175,750
Outstanding Balance
$153,005
Interest Rate
4.8%
Mortgage Type
New Conventional
Estimated Equity
$123,777
Purchase Details
Closed on
May 4, 1999
Sold by
High Country Properties Partners X
Bought by
Copeland & Copeland A Colorado Partnersh
Purchase Details
Closed on
May 4, 1998
Sold by
Shemli Properties Llc
Bought by
High Country Properties Partners X
Purchase Details
Closed on
Jan 26, 1996
Sold by
3700 Company The
Bought by
Shemli Properties Llc
Purchase Details
Closed on
Nov 4, 1994
Sold by
Bush Wesley H
Bought by
3700 Company The
Purchase Details
Closed on
May 13, 1975
Bought by
Bush Dustin C and Bush Edith M
Create a Home Valuation Report for This Property
The Home Valuation Report is an in-depth analysis detailing your home's value as well as a comparison with similar homes in the area
Purchase History
| Date | Buyer | Sale Price | Title Company |
|---|---|---|---|
| Rexford Jeneen Renee | $185,000 | Land Title Guarantee Co | |
| Copeland & Copeland A Colorado Partnersh | $372,500 | -- | |
| High Country Properties Partners X | $25,000 | -- | |
| Shemli Properties Llc | -- | -- | |
| 3700 Company The | $55,000 | -- | |
| Bush Dustin C | $7,500 | -- |
Source: Public Records
Mortgage History
| Date | Status | Borrower | Loan Amount |
|---|---|---|---|
| Open | Rexford Jeneen Renee | $175,750 |
Source: Public Records
Tax History
| Year | Tax Paid | Tax Assessment Tax Assessment Total Assessment is a certain percentage of the fair market value that is determined by local assessors to be the total taxable value of land and additions on the property. | Land | Improvement |
|---|---|---|---|---|
| 2025 | $1,212 | $35,240 | $18,680 | $16,560 |
| 2024 | $1,212 | $13,600 | $2,900 | $10,700 |
| 2023 | $968 | $17,930 | $3,820 | $14,110 |
| 2022 | $820 | $11,910 | $2,780 | $9,130 |
| 2021 | $845 | $12,260 | $2,860 | $9,400 |
| 2020 | $713 | $10,620 | $2,470 | $8,150 |
| 2019 | $717 | $10,620 | $2,470 | $8,150 |
| 2018 | $422 | $6,090 | $1,990 | $4,100 |
| 2017 | $418 | $6,090 | $1,990 | $4,100 |
| 2016 | $407 | $6,020 | $2,010 | $4,010 |
| 2015 | $399 | $6,020 | $2,010 | $4,010 |
| 2014 | $368 | $5,940 | $2,010 | $3,930 |
Source: Public Records
Map
Nearby Homes
- 547 S 6th St
- 543 S 5th St
- 315 & 319 S Cascade Ave
- 447 S 12th St
- 23 S 5th St
- 20 Colorado Ave
- 801 S 7th St
- 124 Columbia Way
- 114 S 2nd St
- 901 S 8th St
- 920 S 5th St
- 918 S 10th St
- 746 S 2nd St
- 1018 S 5th St Unit 7
- 147 E Main St Unit 147 Main , 18 N Se
- 99 Montrose Dr
- 130 W South 1st St
- 741 S 1st St
- TBD Montrose Dr Site C
- 707 N 1st St
- 323 S 8th St
- 730 S Cascade Ave
- 737 S Townsend Ave
- 721 S Townsend Ave
- 720 S Cascade Ave
- 324 S 7th St
- 334 S 7th St
- 318 S 7th St
- 320 S 8th St
- 700 S Cascade Ave
- S S Cascade Ave Unit Corner Cascade and S
- S S Cascade Ave
- S S Cascade Ave Unit 1869 East Main
- 330 S 8th St
- 701 S Townsend Ave
- 802 S Cascade Ave
- 727 S Cascade Ave
- 745 S Cascade Ave
- 709 S Cascade Ave
- 402 S 7th St
Your Personal Tour Guide
Ask me questions while you tour the home.