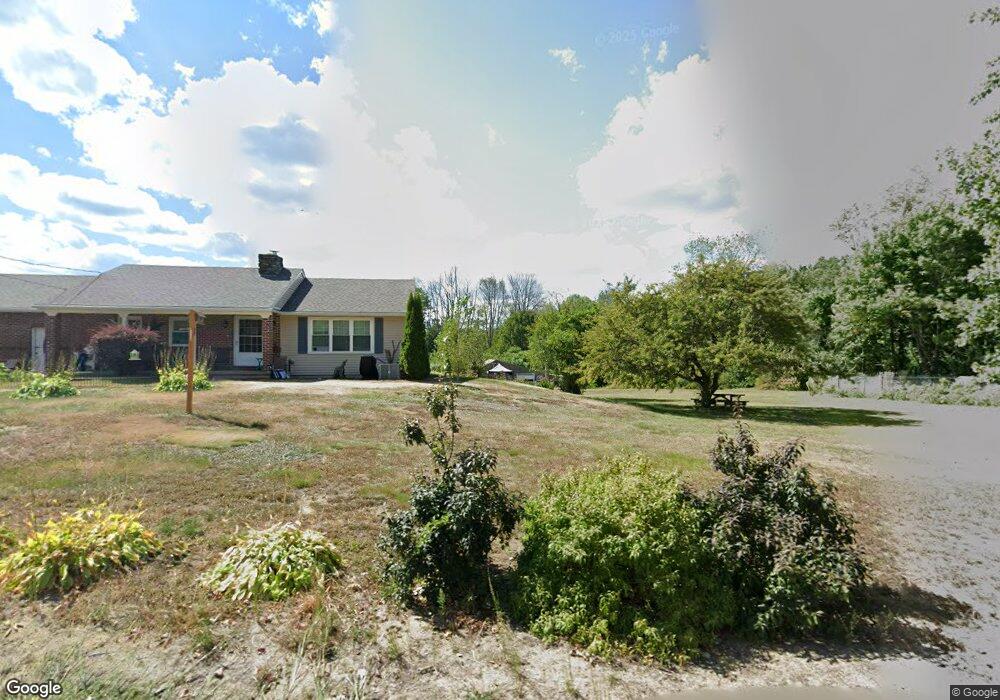
331 South Rd Templeton, MA 01468
Estimated Value: $477,000 - $510,799
3
Beds
2
Baths
1,800
Sq Ft
$277/Sq Ft
Est. Value
About This Home
This home is located at 331 South Rd, Templeton, MA 01468 and is currently estimated at $499,450, approximately $277 per square foot. 331 South Rd is a home located in Worcester County with nearby schools including Narragansett Regional High School.
Ownership History
Date
Name
Owned For
Owner Type
Purchase Details
Closed on
May 22, 2025
Sold by
Casey Gary G and Casey Kathy A
Bought by
Casey Lt and Casey
Current Estimated Value
Purchase Details
Closed on
Oct 11, 2021
Sold by
Casey Gary and Gammell Richard
Bought by
Casey Gary and Casey Kathy
Home Financials for this Owner
Home Financials are based on the most recent Mortgage that was taken out on this home.
Original Mortgage
$197,000
Interest Rate
2.8%
Mortgage Type
New Conventional
Purchase Details
Closed on
Sep 13, 2004
Sold by
Maillet Jennifer and Labonte Joseph
Bought by
Casey Gary and Gammell Richard
Home Financials for this Owner
Home Financials are based on the most recent Mortgage that was taken out on this home.
Original Mortgage
$211,900
Interest Rate
6.08%
Mortgage Type
Purchase Money Mortgage
Create a Home Valuation Report for This Property
The Home Valuation Report is an in-depth analysis detailing your home's value as well as a comparison with similar homes in the area
Home Values in the Area
Average Home Value in this Area
Purchase History
| Date | Buyer | Sale Price | Title Company |
|---|---|---|---|
| Casey Lt | -- | None Available | |
| Casey Lt | -- | None Available | |
| Casey Gary | -- | None Available | |
| Casey Gary | -- | None Available | |
| Casey Gary | -- | None Available | |
| Casey Gary | $264,900 | -- | |
| Casey Gary | $264,900 | -- | |
| Casey Gary | $264,900 | -- |
Source: Public Records
Mortgage History
| Date | Status | Borrower | Loan Amount |
|---|---|---|---|
| Previous Owner | Casey Gary | $197,000 | |
| Previous Owner | Casey Gary | $211,900 | |
| Previous Owner | Casey Gary | $45,000 |
Source: Public Records
Tax History Compared to Growth
Tax History
| Year | Tax Paid | Tax Assessment Tax Assessment Total Assessment is a certain percentage of the fair market value that is determined by local assessors to be the total taxable value of land and additions on the property. | Land | Improvement |
|---|---|---|---|---|
| 2025 | $5,351 | $441,500 | $62,200 | $379,300 |
| 2024 | $5,267 | $418,000 | $55,200 | $362,800 |
| 2023 | $5,017 | $388,300 | $55,200 | $333,100 |
| 2022 | $5,191 | $340,600 | $37,200 | $303,400 |
| 2021 | $4,946 | $307,000 | $37,200 | $269,800 |
| 2020 | $4,667 | $277,300 | $37,200 | $240,100 |
| 2018 | $4,030 | $241,000 | $33,800 | $207,200 |
| 2017 | $3,785 | $234,800 | $33,800 | $201,000 |
| 2016 | $3,630 | $220,400 | $33,800 | $186,600 |
Source: Public Records
Map
Nearby Homes
- 3 Gary Rd
- 65 Victoria Ln
- 171 South Rd
- 87 Hubbardston Rd
- 0 Hubbardston Rd Unit 73407169
- 14 Baldwinville Rd
- 40 Burnshirt Rd
- 99 Turner Ln
- 18 S Main St
- 133 Patriots Rd
- 0 Gardner Rd Unit Applewood
- 0 Gardner Rd Unit Willow
- 0 Mill St Unit 5033403
- 0 Mill St Unit 5007531
- 0 Mill St Unit 4996202
- 0 Mill St Unit 21522962
- 54 Orchard Ln
- 14 Baker Ln
- 225 Queen Lake Rd
- 240 Barre Rd