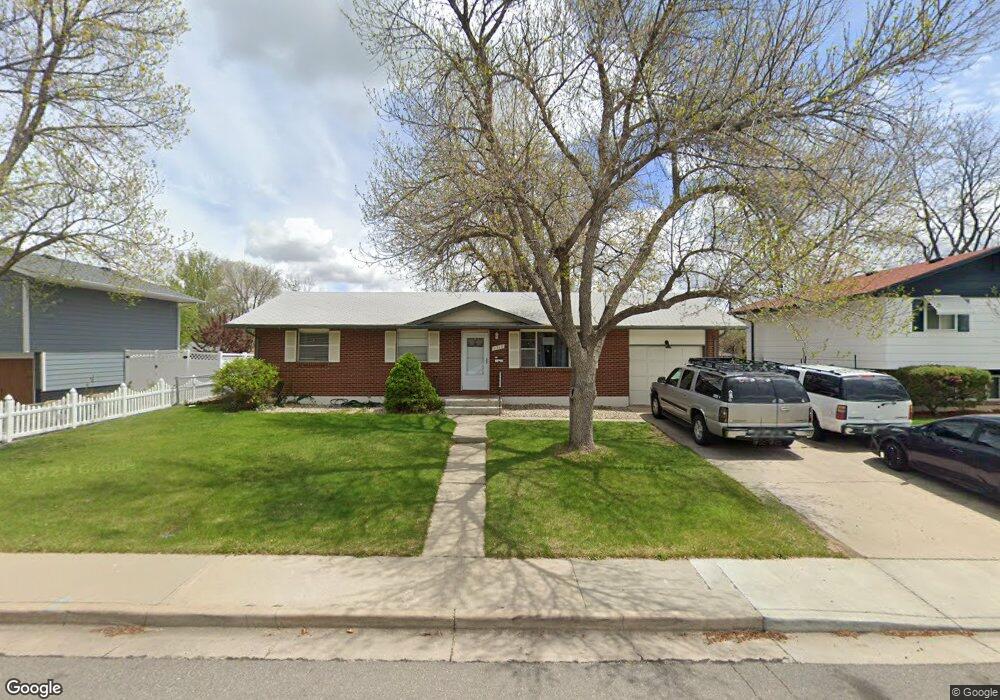
3310 N Franklin Ave Loveland, CO 80538
Estimated Value: $392,562 - $431,000
3
Beds
2
Baths
1,108
Sq Ft
$369/Sq Ft
Est. Value
About This Home
This home is located at 3310 N Franklin Ave, Loveland, CO 80538 and is currently estimated at $408,891, approximately $369 per square foot. 3310 N Franklin Ave is a home located in Larimer County with nearby schools including Lincoln Elementary School, Lucile Erwin Middle School, and Loveland High School.
Ownership History
Date
Name
Owned For
Owner Type
Purchase Details
Closed on
Jul 14, 2021
Sold by
Franklin Llc
Bought by
Pronozuk Anthony J and Pronozuk Karen
Current Estimated Value
Home Financials for this Owner
Home Financials are based on the most recent Mortgage that was taken out on this home.
Original Mortgage
$296,250
Interest Rate
3.14%
Mortgage Type
New Conventional
Purchase Details
Closed on
Nov 10, 2017
Sold by
Pronozuk Anthony J and Pronozuk Karen
Bought by
Franklin Llc
Purchase Details
Closed on
Aug 4, 2017
Sold by
Magee Patricia S
Bought by
Pronozuk Anthony J and Pronozuk Karen
Home Financials for this Owner
Home Financials are based on the most recent Mortgage that was taken out on this home.
Original Mortgage
$204,000
Interest Rate
4.25%
Mortgage Type
Adjustable Rate Mortgage/ARM
Purchase Details
Closed on
Jul 17, 2000
Sold by
Stoll Caroline J
Bought by
Magee Patricia S
Create a Home Valuation Report for This Property
The Home Valuation Report is an in-depth analysis detailing your home's value as well as a comparison with similar homes in the area
Home Values in the Area
Average Home Value in this Area
Purchase History
| Date | Buyer | Sale Price | Title Company |
|---|---|---|---|
| Pronozuk Anthony J | -- | None Available | |
| Franklin Llc | -- | None Available | |
| Pronozuk Anthony J | $255,000 | First American Title | |
| Magee Patricia S | $152,900 | -- |
Source: Public Records
Mortgage History
| Date | Status | Borrower | Loan Amount |
|---|---|---|---|
| Previous Owner | Pronozuk Anthony J | $296,250 | |
| Previous Owner | Pronozuk Anthony J | $204,000 |
Source: Public Records
Tax History Compared to Growth
Tax History
| Year | Tax Paid | Tax Assessment Tax Assessment Total Assessment is a certain percentage of the fair market value that is determined by local assessors to be the total taxable value of land and additions on the property. | Land | Improvement |
|---|---|---|---|---|
| 2025 | $1,775 | $25,929 | $3,015 | $22,914 |
| 2024 | $1,712 | $25,929 | $3,015 | $22,914 |
| 2022 | $1,615 | $20,295 | $3,128 | $17,167 |
| 2021 | $1,659 | $20,879 | $3,218 | $17,661 |
| 2020 | $1,541 | $19,377 | $3,218 | $16,159 |
| 2019 | $1,515 | $19,377 | $3,218 | $16,159 |
| 2018 | $1,446 | $17,568 | $3,240 | $14,328 |
| 2017 | $735 | $17,568 | $3,240 | $14,328 |
| 2016 | $569 | $15,506 | $3,582 | $11,924 |
| 2015 | $564 | $15,500 | $3,580 | $11,920 |
| 2014 | $506 | $13,460 | $3,580 | $9,880 |
Source: Public Records
Map
Nearby Homes
- 3312 N Colorado Ave
- 3210 N Colorado Ave
- 3110 N Franklin Ave
- 3321 Butternut Dr
- 3523 N Franklin Ave
- 717 W 36th St
- 367 Limber Place
- 3638 Butternut Dr Unit 7A
- 706 W 29th St
- 3750 Sheridan Ave
- 2640 Logan Dr
- 1221 Bay Ct
- 4019 Burr Oak Dr
- 957 Logan Ct
- 2609 Cedar Dr
- 4056 Boxelder Dr
- 1463 Caddoa Dr
- 4105 N Garfield Ave Unit 100
- 4105 N Garfield Ave Unit 61
- 3621 Adena Ct
- 3314 N Franklin Ave
- 3306 N Franklin Ave
- 3313 Sheridan Ave
- 3317 Sheridan Ave
- 3309 Sheridan Ave
- 3318 N Franklin Ave
- 3302 N Franklin Ave
- 3309 N Franklin Ave
- 3321 Sheridan Ave
- 603 W 33rd St
- 3305 N Franklin Ave
- 3322 N Franklin Ave
- 3317 N Franklin Ave
- 3301 N Franklin Ave
- 3325 Sheridan Ave
- 3321 N Franklin Ave
- 3404 N Franklin Ave
- 604 W 33rd St
- 3312 Sheridan Ave
- 3308 N Colorado Ave