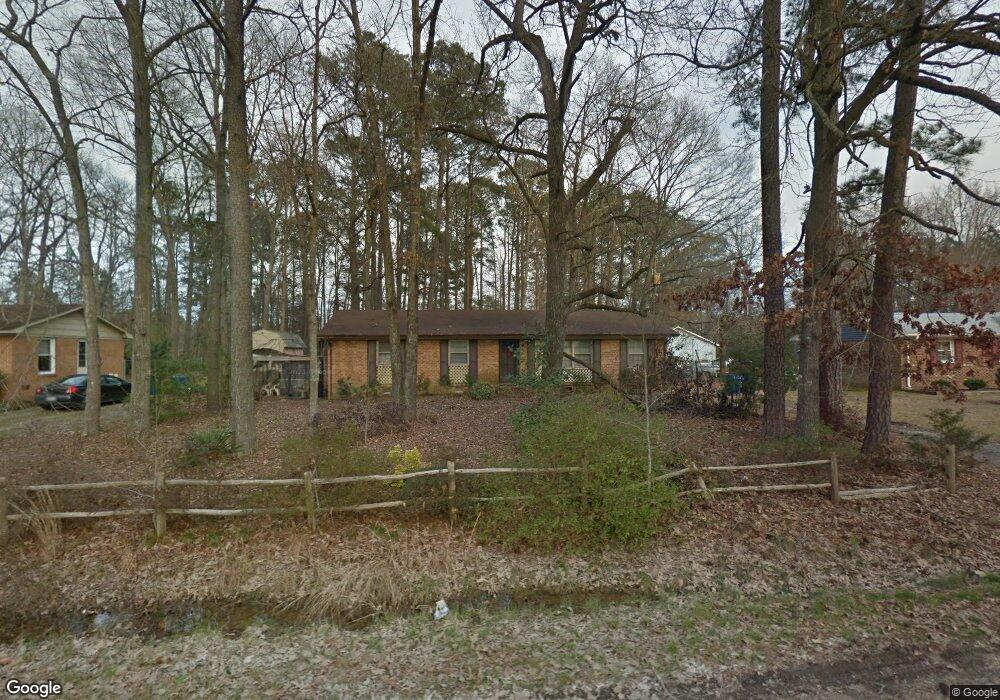
3311 C View Rd Durham, NC 27713
South Durham NeighborhoodEstimated Value: $288,000 - $339,063
3
Beds
2
Baths
1,362
Sq Ft
$229/Sq Ft
Est. Value
About This Home
This home is located at 3311 C View Rd, Durham, NC 27713 and is currently estimated at $311,766, approximately $228 per square foot. 3311 C View Rd is a home located in Durham County with nearby schools including R.N. Harris Elementary School, James E. Shepard Middle School, and Hillside High School.
Ownership History
Date
Name
Owned For
Owner Type
Purchase Details
Closed on
Apr 3, 2017
Sold by
Hock Homes Llc
Bought by
Parker Gerald C
Current Estimated Value
Home Financials for this Owner
Home Financials are based on the most recent Mortgage that was taken out on this home.
Original Mortgage
$153,260
Outstanding Balance
$127,150
Interest Rate
4.1%
Mortgage Type
New Conventional
Estimated Equity
$184,616
Purchase Details
Closed on
Sep 7, 2016
Sold by
Vallario Peter A
Bought by
Hock Homes Llc
Home Financials for this Owner
Home Financials are based on the most recent Mortgage that was taken out on this home.
Original Mortgage
$50,000
Interest Rate
3.45%
Mortgage Type
New Conventional
Purchase Details
Closed on
Apr 16, 2010
Sold by
Vallario Peter A and Vallario Phyllis
Bought by
Vallario Peter A and Vallario Phyllis P
Home Financials for this Owner
Home Financials are based on the most recent Mortgage that was taken out on this home.
Original Mortgage
$113,858
Interest Rate
4.87%
Mortgage Type
FHA
Create a Home Valuation Report for This Property
The Home Valuation Report is an in-depth analysis detailing your home's value as well as a comparison with similar homes in the area
Home Values in the Area
Average Home Value in this Area
Purchase History
| Date | Buyer | Sale Price | Title Company |
|---|---|---|---|
| Parker Gerald C | $158,000 | -- | |
| Hock Homes Llc | $71,000 | -- | |
| Vallario Peter A | -- | None Available |
Source: Public Records
Mortgage History
| Date | Status | Borrower | Loan Amount |
|---|---|---|---|
| Open | Parker Gerald C | $153,260 | |
| Previous Owner | Hock Homes Llc | $50,000 | |
| Previous Owner | Hock Homes Llc | $70,000 | |
| Previous Owner | Vallario Peter A | $113,858 |
Source: Public Records
Tax History
| Year | Tax Paid | Tax Assessment Tax Assessment Total Assessment is a certain percentage of the fair market value that is determined by local assessors to be the total taxable value of land and additions on the property. | Land | Improvement |
|---|---|---|---|---|
| 2025 | $3,746 | $377,853 | $138,700 | $239,153 |
| 2024 | $2,229 | $159,820 | $29,200 | $130,620 |
| 2023 | $2,093 | $159,820 | $29,200 | $130,620 |
| 2022 | $2,046 | $159,820 | $29,200 | $130,620 |
| 2021 | $2,036 | $159,820 | $29,200 | $130,620 |
| 2020 | $1,988 | $159,820 | $29,200 | $130,620 |
| 2019 | $1,988 | $159,820 | $29,200 | $130,620 |
| 2018 | $1,841 | $135,740 | $29,200 | $106,540 |
| 2017 | $1,823 | $135,352 | $29,200 | $106,152 |
| 2016 | $1,761 | $135,352 | $29,200 | $106,152 |
| 2015 | $1,773 | $128,063 | $27,504 | $100,559 |
| 2014 | $1,773 | $128,063 | $27,504 | $100,559 |
Source: Public Records
Map
Nearby Homes
- 2010 Eastwood Dr
- 1912 So Hi Dr
- 1661 Holly Grove Way
- 1108 Nova St
- 1100 Nova St
- 2638 S Alston Ave
- 3514 S Alston Ave
- 1674 Snowmass Way
- 3005 Courtney Creek Blvd
- 2806 Wyntercrest Ln
- 2717 Wyntercrest Ln
- 2605 Magnolia Tree Ln
- 52 Holly Berry Ln
- 3331 Tarleton E Unit 8
- 3311 Tarleton W Unit 6
- 1218 Helms St
- 1220 Helms St
- 1222 Helms St
- 1224 Helms St
- 1226 Helms St
- 3311 C-View St
- 3307 C-View St
- 3315 C View Rd
- 3307 C View Rd
- 3319 C View Rd
- 3301 C View Rd
- 3319 C-View St
- 2021 Eastwood Dr
- 3325 C View Rd
- 3323 C View Rd
- 3323 C-View St
- 2029 Eastwood Dr
- 3322 C View Rd
- 2015 Eastwood Dr
- 2027 Eastwood Dr
- 0 Dial Dr
- 1804 Dial Dr
- 1823 Dial Dr
- 1808 Dial Dr
- 1808 Dial Dr Unit 10
Your Personal Tour Guide
Ask me questions while you tour the home.