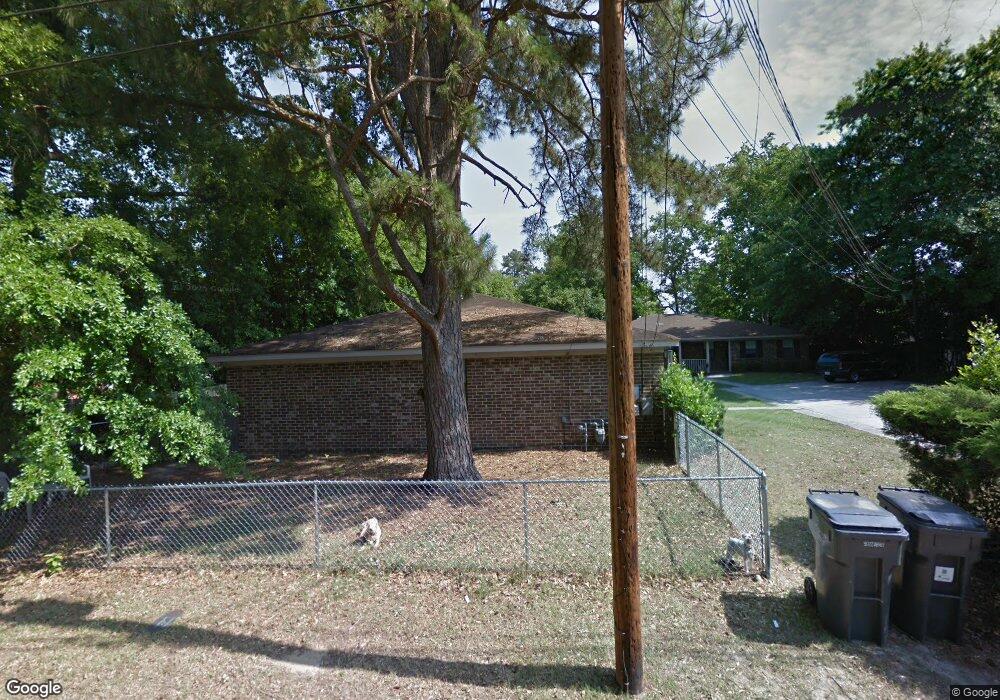
3311 McDonald St Augusta, GA 30907
Montclair NeighborhoodEstimated Value: $220,450 - $314,000
4
Beds
2
Baths
1,948
Sq Ft
$136/Sq Ft
Est. Value
About This Home
This home is located at 3311 McDonald St, Augusta, GA 30907 and is currently estimated at $264,113, approximately $135 per square foot. 3311 McDonald St is a home located in Richmond County with nearby schools including First Coast Technical Institute, R.B. Hunt Elementary School, and Warren Road Elementary School.
Ownership History
Date
Name
Owned For
Owner Type
Purchase Details
Closed on
Feb 5, 2016
Sold by
Johnson Birnet Leland Estate
Bought by
Vickr Rentals Llc
Current Estimated Value
Purchase Details
Closed on
Jul 15, 1993
Sold by
Barclaysamerican/Mortgage Corp Barclays
Bought by
Johnson Birnet L
Purchase Details
Closed on
Jun 30, 1993
Sold by
Barclaysamerican
Bought by
Johnson Birnet L
Purchase Details
Closed on
Jun 21, 1993
Sold by
Sec Of Hud
Bought by
Easler J R Easler Anne S
Purchase Details
Closed on
Apr 29, 1993
Sold by
Barclaysamerican Mortgage Corp Barclays
Bought by
Federal National Mortgage Assn
Purchase Details
Closed on
Jan 4, 1993
Sold by
Barclaysamerican Mortgage Corp Barclays
Bought by
Housing & Urban Development Secretary Of
Create a Home Valuation Report for This Property
The Home Valuation Report is an in-depth analysis detailing your home's value as well as a comparison with similar homes in the area
Home Values in the Area
Average Home Value in this Area
Purchase History
| Date | Buyer | Sale Price | Title Company |
|---|---|---|---|
| Vickr Rentals Llc | $155,000 | -- | |
| Johnson Birnet L | -- | -- | |
| Johnson Birnet L | $80,000 | -- | |
| Easler J R Easler Anne S | -- | -- | |
| Federal National Mortgage Assn | -- | -- | |
| Housing & Urban Development Secretary Of | -- | -- |
Source: Public Records
Tax History Compared to Growth
Tax History
| Year | Tax Paid | Tax Assessment Tax Assessment Total Assessment is a certain percentage of the fair market value that is determined by local assessors to be the total taxable value of land and additions on the property. | Land | Improvement |
|---|---|---|---|---|
| 2025 | $2,940 | $77,986 | $9,600 | $68,386 |
| 2024 | $2,940 | $65,665 | $9,600 | $56,065 |
| 2023 | $2,480 | $89,340 | $9,600 | $79,740 |
| 2022 | $2,209 | $53,650 | $9,600 | $44,050 |
| 2021 | $2,264 | $50,696 | $9,600 | $41,096 |
| 2020 | $2,402 | $50,696 | $9,600 | $41,096 |
| 2019 | $1,768 | $32,830 | $2,439 | $30,391 |
| 2018 | $1,777 | $32,830 | $2,439 | $30,391 |
| 2017 | $1,613 | $32,830 | $2,439 | $30,391 |
| 2016 | $1,714 | $32,830 | $2,439 | $30,391 |
| 2015 | $1,537 | $32,830 | $2,439 | $30,391 |
| 2014 | $1,724 | $32,830 | $2,439 | $30,391 |
Source: Public Records
Map
Nearby Homes
- 3307A McDonald St
- 115 Clark St
- 385 Folkstone Cir
- 218 Folkstone Cir
- 3324 Westcliffe Ct
- 3319 Thread Needle Rd W
- 3330 Thread Needle Rd W
- 203 Buckhead Ct
- 306 Pleasant Home Rd
- 2904 Pleasant Ct
- 225 Chatham Rd
- 2205 Pleasant Dr
- 221 Simmons Ct
- 2208 Pleasant Dr
- 311 Gardners Mill Ct
- 227 Simmons Ct
- 3311 Ansley Ct
- 304 Hornhead Dr
- 213 Kings Chapel Rd
- 320 Furys Ferry Rd
- 3309 McDonald St
- 118 Clark St
- 3307B McDonald St
- 3307 McDonald St
- 3307 McDonald St
- 3312 McDonald St
- 116 Clark St
- 3310 McDonald St
- 1833 McDonald St
- 120 Clark St
- 3308 McDonald St
- 3305 McDonald St
- 3306 McDonald St
- 3302 McDonald St
- 119 Clark St
- 117 Clark St
- 121 Clark St
- 3317 Davant St
- 3315 Davant St
- 376 Folkstone Cir