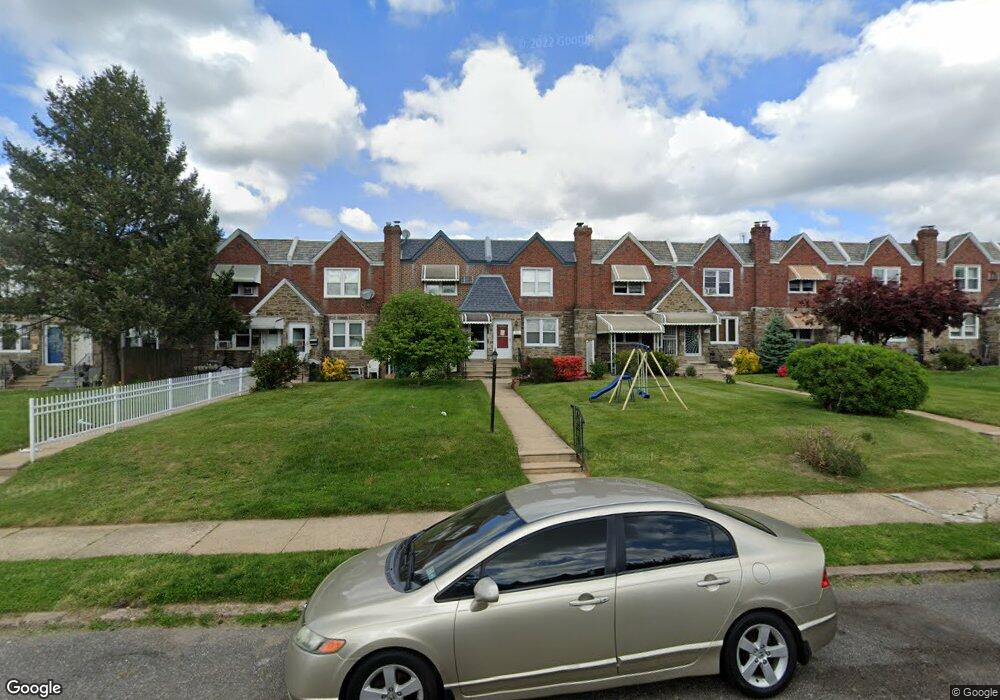
3311 Oakmont St Philadelphia, PA 19136
Mayfair NeighborhoodEstimated Value: $253,612 - $274,000
3
Beds
2
Baths
1,190
Sq Ft
$219/Sq Ft
Est. Value
About This Home
This home is located at 3311 Oakmont St, Philadelphia, PA 19136 and is currently estimated at $260,903, approximately $219 per square foot. 3311 Oakmont St is a home located in Philadelphia County with nearby schools including Lincoln High School, Meehan Austin Middle School, and Northeast Community Propel Academy.
Ownership History
Date
Name
Owned For
Owner Type
Purchase Details
Closed on
Nov 20, 2017
Sold by
Caines Eric
Bought by
Penington Carl
Current Estimated Value
Home Financials for this Owner
Home Financials are based on the most recent Mortgage that was taken out on this home.
Original Mortgage
$181,649
Outstanding Balance
$153,911
Interest Rate
4.37%
Mortgage Type
FHA
Estimated Equity
$106,992
Purchase Details
Closed on
Oct 22, 2004
Sold by
Rocco Timothy
Bought by
Caines Eric
Home Financials for this Owner
Home Financials are based on the most recent Mortgage that was taken out on this home.
Original Mortgage
$144,450
Interest Rate
5.71%
Mortgage Type
Purchase Money Mortgage
Purchase Details
Closed on
May 26, 2004
Sold by
Thomson Helen E
Bought by
Rocco Timothy
Home Financials for this Owner
Home Financials are based on the most recent Mortgage that was taken out on this home.
Original Mortgage
$54,000
Interest Rate
6.32%
Mortgage Type
Purchase Money Mortgage
Create a Home Valuation Report for This Property
The Home Valuation Report is an in-depth analysis detailing your home's value as well as a comparison with similar homes in the area
Home Values in the Area
Average Home Value in this Area
Purchase History
| Date | Buyer | Sale Price | Title Company |
|---|---|---|---|
| Penington Carl | $185,000 | Green Abstract Llc | |
| Caines Eric | $135,000 | Lawyers Title Ins | |
| Rocco Timothy | $60,000 | -- |
Source: Public Records
Mortgage History
| Date | Status | Borrower | Loan Amount |
|---|---|---|---|
| Open | Penington Carl | $181,649 | |
| Previous Owner | Caines Eric | $144,450 | |
| Previous Owner | Rocco Timothy | $54,000 |
Source: Public Records
Tax History Compared to Growth
Tax History
| Year | Tax Paid | Tax Assessment Tax Assessment Total Assessment is a certain percentage of the fair market value that is determined by local assessors to be the total taxable value of land and additions on the property. | Land | Improvement |
|---|---|---|---|---|
| 2026 | $2,795 | $247,500 | $49,500 | $198,000 |
| 2025 | $2,795 | $247,500 | $49,500 | $198,000 |
| 2024 | $2,795 | $247,500 | $49,500 | $198,000 |
| 2023 | $2,795 | $199,700 | $39,940 | $159,760 |
| 2022 | $2,349 | $199,700 | $39,940 | $159,760 |
| 2021 | $2,349 | $0 | $0 | $0 |
| 2020 | $2,349 | $0 | $0 | $0 |
| 2019 | $2,275 | $0 | $0 | $0 |
| 2018 | $1,929 | $0 | $0 | $0 |
| 2017 | $1,929 | $0 | $0 | $0 |
| 2016 | $1,929 | $0 | $0 | $0 |
| 2015 | $1,847 | $0 | $0 | $0 |
| 2014 | -- | $137,800 | $31,554 | $106,246 |
| 2012 | -- | $16,672 | $1,866 | $14,806 |
Source: Public Records
Map
Nearby Homes
- 3318 Oakmont St
- 3317 Shelmire Ave
- 3335 Shelmire Ave
- 3413 Shelmire Ave
- 3315 Chippendale Ave
- 3316 Vista St
- 3310 Sheffield Ave
- 3411 Chippendale Ave
- 3307 Sheffield St
- 3405 Sheffield St
- 3411 Tudor St
- 3528 Chippendale Ave
- 3532 Shelmire Ave
- 3324 Tudor St
- 3547 Shelmire Ave
- 3448 Tudor St
- 3414 Hartel Ave
- 4224 Chippendale Ave
- 3556 Meridian St
- 3550 Tudor St
- 3309 Oakmont St
- 3313 Oakmont St
- 3315 Oakmont St
- 3307 Oakmont St
- 3305 Oakmont St
- 3317 Oakmont St
- 3319 Oakmont St
- 3303 Oakmont St
- 3321 Oakmont St
- 3301 Oakmont St
- 3323 Oakmont St
- 3310 Chippendale St
- 3312 Chippendale St
- 3308 Chippendale St
- 3314 Chippendale St
- 3316 Chippendale St
- 3306 Chippendale St
- 3304 Chippendale St
- 3318 Chippendale St
- 3325 Oakmont St