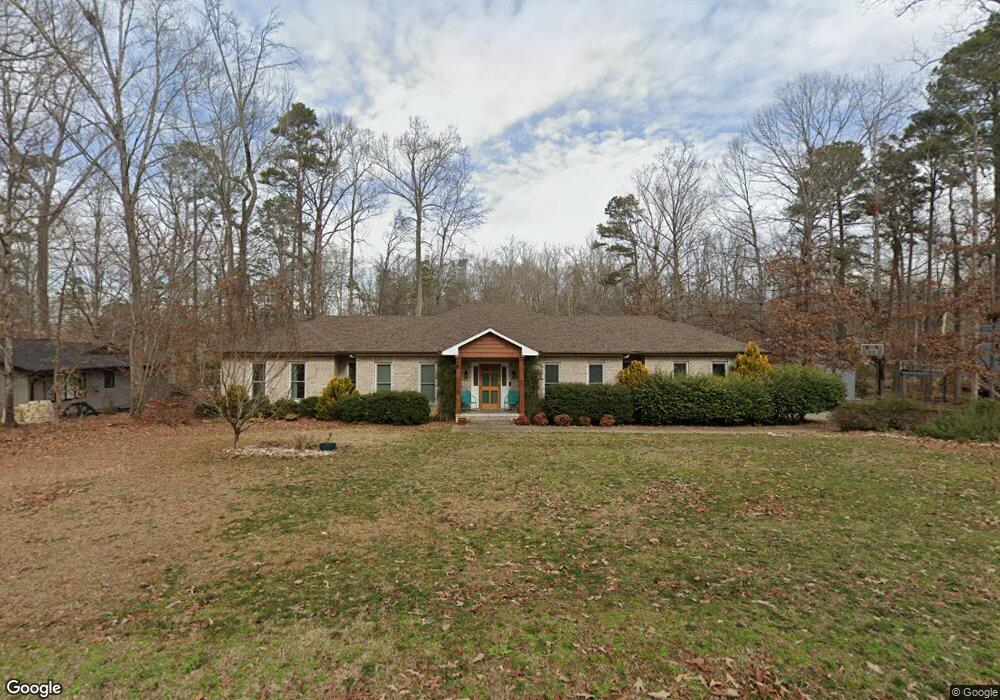
3311 Timberlake Rd Raleigh, NC 27604
Northeast Raleigh NeighborhoodEstimated Value: $515,000 - $591,000
2
Beds
2
Baths
1,805
Sq Ft
$303/Sq Ft
Est. Value
About This Home
This home is located at 3311 Timberlake Rd, Raleigh, NC 27604 and is currently estimated at $547,609, approximately $303 per square foot. 3311 Timberlake Rd is a home located in Wake County with nearby schools including Wilburn Elementary, Durant Road Middle, and Millbrook High School.
Ownership History
Date
Name
Owned For
Owner Type
Purchase Details
Closed on
Mar 3, 2017
Sold by
M Ray Johnson Investments Llc
Bought by
Johnson Thomas B and Johnson Robin T
Current Estimated Value
Home Financials for this Owner
Home Financials are based on the most recent Mortgage that was taken out on this home.
Original Mortgage
$7,129
Outstanding Balance
$5,915
Interest Rate
4.19%
Mortgage Type
Unknown
Estimated Equity
$541,694
Purchase Details
Closed on
Oct 10, 2016
Sold by
Wood David M and Hinman Alice M
Bought by
M Ray Johnson Investments Llc
Purchase Details
Closed on
Jul 22, 2015
Sold by
Khalilian Abdoul Reza
Bought by
Wood David M
Home Financials for this Owner
Home Financials are based on the most recent Mortgage that was taken out on this home.
Original Mortgage
$135,000
Interest Rate
4.08%
Mortgage Type
VA
Purchase Details
Closed on
Jan 1, 1969
Bought by
Khalilian Abdoul Reza
Create a Home Valuation Report for This Property
The Home Valuation Report is an in-depth analysis detailing your home's value as well as a comparison with similar homes in the area
Home Values in the Area
Average Home Value in this Area
Purchase History
| Date | Buyer | Sale Price | Title Company |
|---|---|---|---|
| Johnson Thomas B | $24,500 | None Available | |
| M Ray Johnson Investments Llc | $260,000 | None Available | |
| Wood David M | $245,000 | Attorney | |
| Khalilian Abdoul Reza | $6,500 | -- |
Source: Public Records
Mortgage History
| Date | Status | Borrower | Loan Amount |
|---|---|---|---|
| Open | Johnson Thomas B | $7,129 | |
| Open | Johnson Thomas B | $237,650 | |
| Previous Owner | Wood David M | $135,000 |
Source: Public Records
Tax History Compared to Growth
Tax History
| Year | Tax Paid | Tax Assessment Tax Assessment Total Assessment is a certain percentage of the fair market value that is determined by local assessors to be the total taxable value of land and additions on the property. | Land | Improvement |
|---|---|---|---|---|
| 2025 | $3,385 | $526,057 | $144,000 | $382,057 |
| 2024 | $3,287 | $526,057 | $144,000 | $382,057 |
| 2023 | $2,258 | $287,021 | $60,000 | $227,021 |
| 2022 | $2,093 | $287,021 | $60,000 | $227,021 |
| 2021 | $2,037 | $287,021 | $60,000 | $227,021 |
| 2020 | $2,003 | $287,021 | $60,000 | $227,021 |
| 2019 | $1,956 | $237,013 | $66,000 | $171,013 |
| 2018 | $1,799 | $237,013 | $66,000 | $171,013 |
| 2017 | $1,705 | $237,013 | $66,000 | $171,013 |
| 2016 | $1,671 | $237,013 | $66,000 | $171,013 |
| 2015 | -- | $242,395 | $62,400 | $179,995 |
| 2014 | $1,615 | $242,395 | $62,400 | $179,995 |
Source: Public Records
Map
Nearby Homes
- 2103 Kilburn Rd
- 3213 Marie Dr
- 3225 Marie Dr
- 1809 Billingham Ct
- 3209 Marie Dr
- 2023 Seneca Dr Unit Lot 32
- 2130 Timberlake Dr
- 3521 Triad Ct
- Ellerbe Plan at Piedmont Point
- 3455 Piedmont Dr
- 2105 Langdon Rd
- 2109 Langdon Rd
- 2209 Dobbin Place
- 3521 Piedmont Dr
- 2108 Carthage Cir
- 2316 Carthage Cir
- 3129 Skycrest Dr
- 2304 Fields of Broadlands Dr
- 2407 Trout Stream Dr
- 2527 Trout Stream Dr
- 3317 Timberlake Rd
- 3307 Timberlake Rd
- 3304 Shady Ln
- 2100 Lakeshore Dr
- 3308 Shady Ln
- 3308 Timberlake Rd
- 2112 Lakeshore Dr
- 3314 Timberlake Rd
- 2010 Lakeshore Dr
- 3401 Forest Rd
- 2101 Kilburn Rd
- 3324 Timberlake Rd
- 2113 Lakeshore Dr
- 2105 Kilburn Rd
- 3311 Marie Dr
- 4813 Shady Ln
- 3307 Marie Dr
- 3001 Shady Ln
- 3315 Marie Dr
- 3224 Timberlake Rd